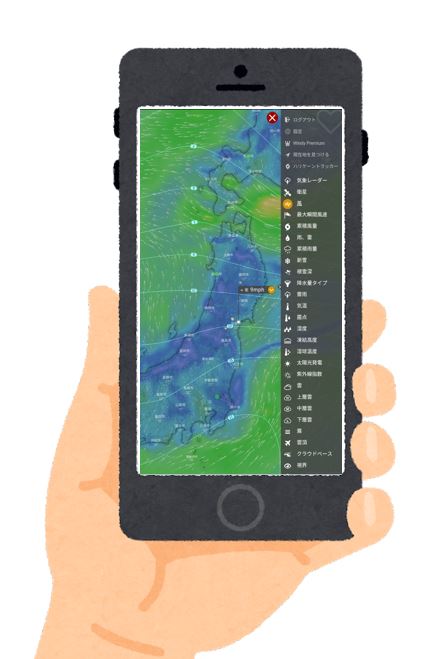
- Type and description of each layer
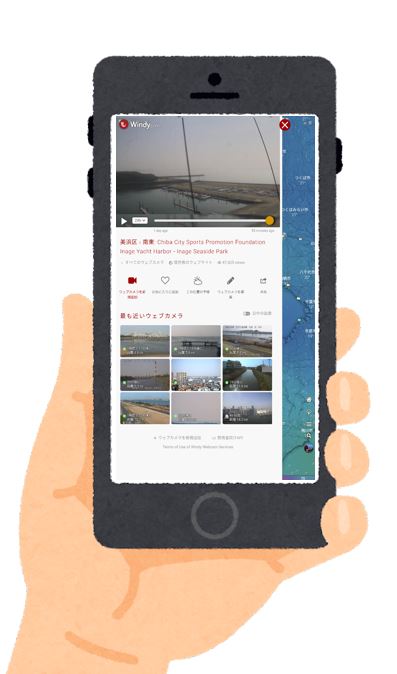
- Display and confirmation of weather radar images
- Meteorological satellite Display and confirmation of observation images
- Layer Wind
- Layer wind gusts
- Layer Wind accumulation
- Windy Layer rain, thunder
- Difference between snowfall amount and snow depth (snow cover amount)
- Layer temperature
- 8.Layer Wet-bulb temp
- Layer Solar Power
- Layer UV Index
- Layer cloud
- Layer Visibility
- 13.Layer CAPE Index(Convective Available Potential Energy )
- Layer Thermals
- Layer wave
- Layer Seawater temperature
- Layer current
- Layer tidal current
- Layer Nitrogen dioxide NO₂
- Layer PM2.5 (microparticulate matter)
- Layer aerosol
- Layer Ozone
- Layer sulfur dioxide SO₂
- Layer tropospheric ozone (photochemical oxidant)
- Layer monoxide concentration (CO)
- Layer dust mass
- Fire intensity
- Layer Pressure (MSLP Mean Sea Level pressure)
- Layer Extreme forecast
- Layer Weather warnings
- layer Outdoor map
- Layer Soil moisture
- Layer Moisture anomaly
- Layer Drought intensity
- summary
Type and description of each layer
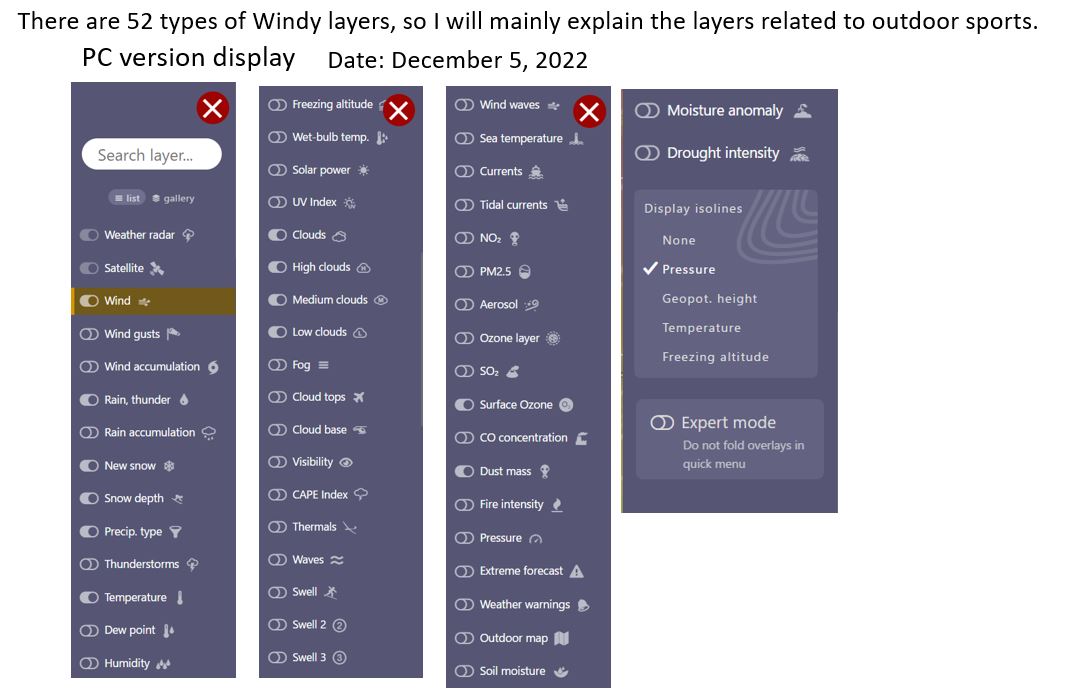
The layers that can be displayed on Windy.com are contour lines, wind, rain, temperature, clouds, waves, etc., and each layer has a detailed type.
If you select a layer that is not displayed in the quick menu, click “Other layers <” at the bottom of the quick menu to display a list of all layers that can be displayed.
Windy has a total number of layers, so I will mainly explain the layers related to climbing and fishing.
(As of December 2022)
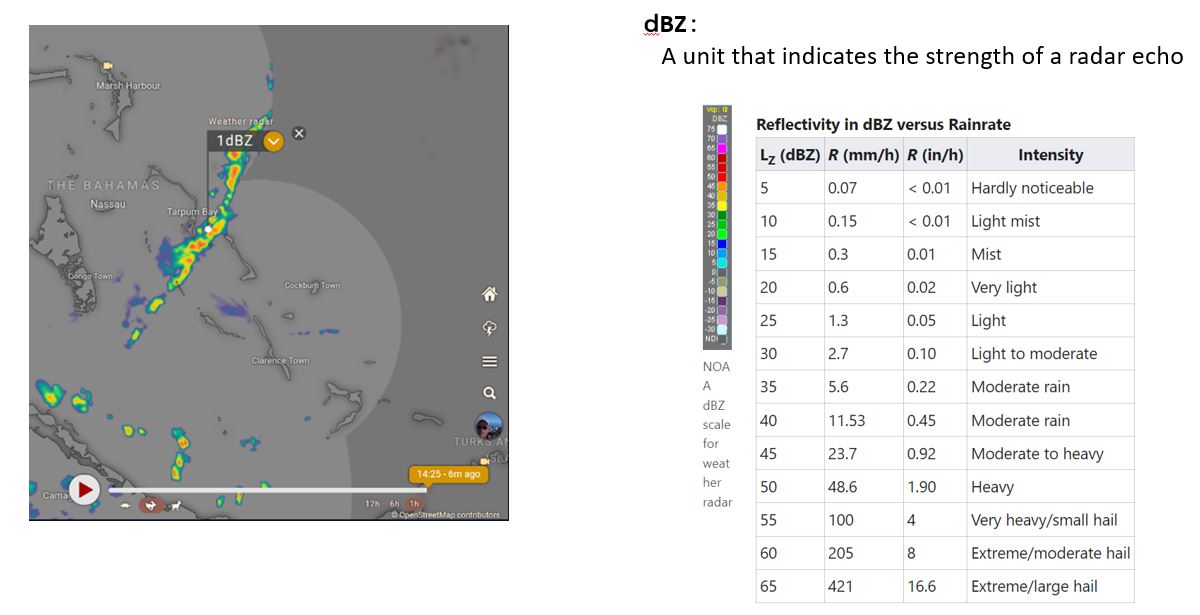
Display and confirmation of weather radar images
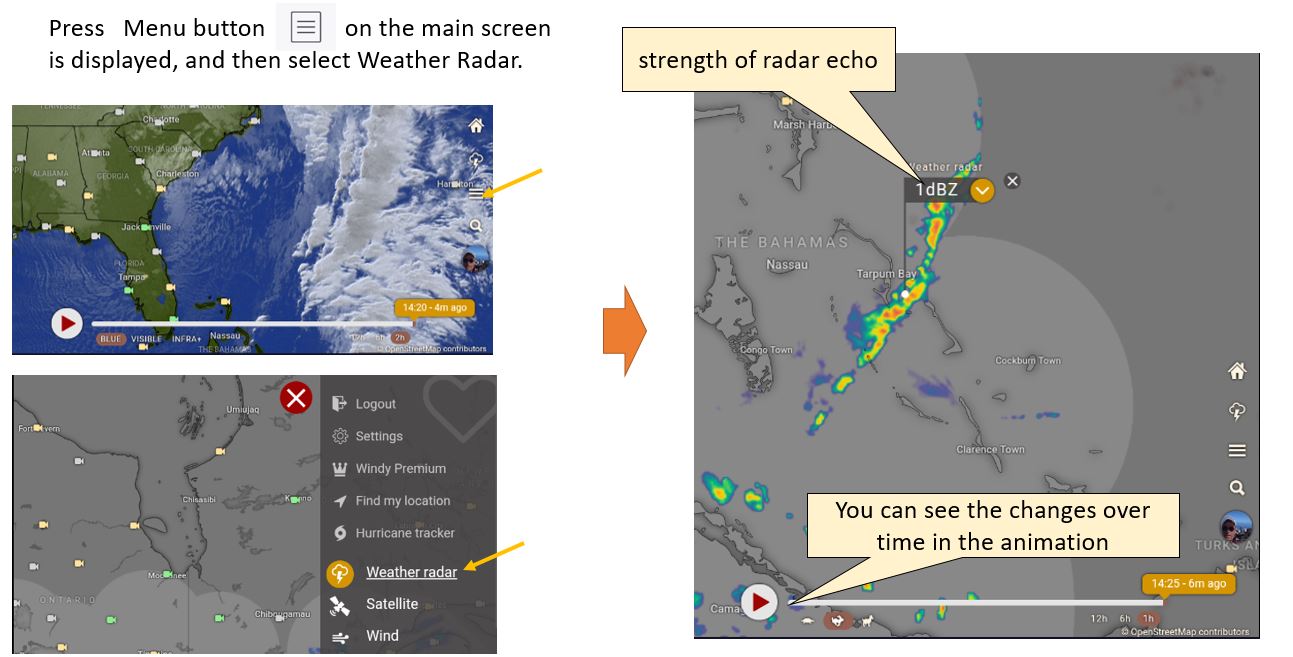
What is weather radar?
By radiating electromagnetic waves from the antenna and analyzing the reflected electromagnetic waves, the position and density of rain and snow, wind speed and direction can be observed.
Meteorological satellite Display and confirmation of observation images
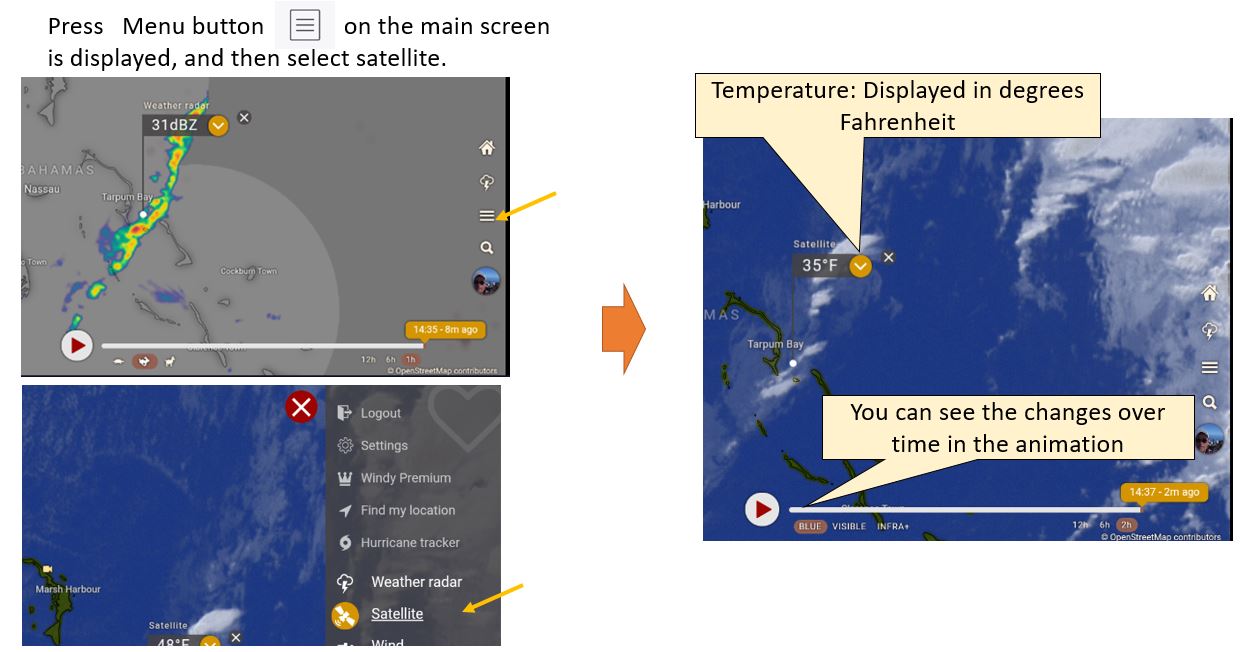
What is a weather satellite observation image?
You can see the latest movement of clouds as seen from space on meteorological satellite images.
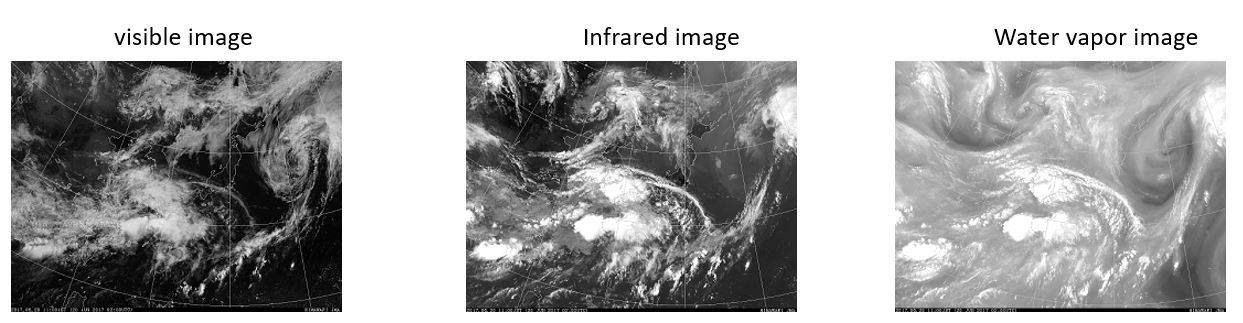
Visible and infrared radiometers mounted on geostationary meteorological satellites observe the strength of electromagnetic waves in various wavelength bands(From “visible light” that can be seen by the human eye to invisible “infrared light” (observable regardless of day or night))
These observation results are displayed as cloud images.
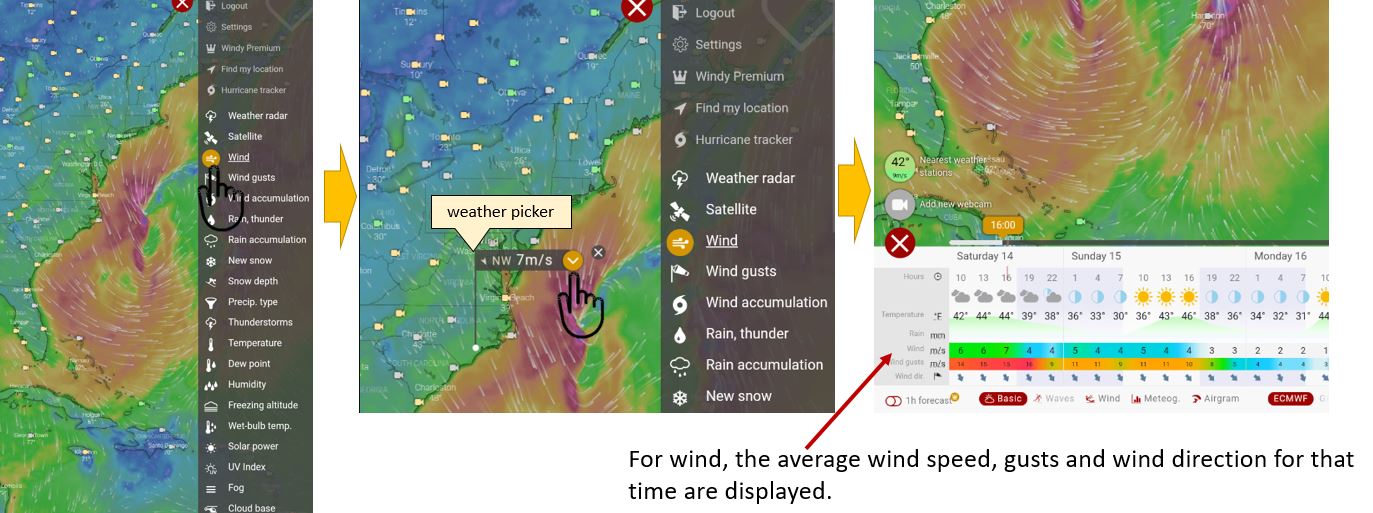
Layer Wind
Check before going windsurfing, kitesurfing or sailing.
If you press the wind layer and tap the place you want to check on the map, a weather picker will appear and you can see the strength of the wind like “ NW 7m/s “.
You can see the weather and details by tapping the orange icon on the side.
What is wind speed and maximum instantaneous wind speed (gust)?
Wind speed is the speed at which air moves as wind. In surface weather observation, it refers to the average wind speed for 10 minutes at a height of about 10 meters above the ground, and is expressed as 〇m per second or 〇m/s.
The wind is constantly fluctuating, getting stronger and weaker in a short time. This instantaneous wind speed is called “instantaneous wind speed”, and its maximum value is called “maximum instantaneous wind speed”.
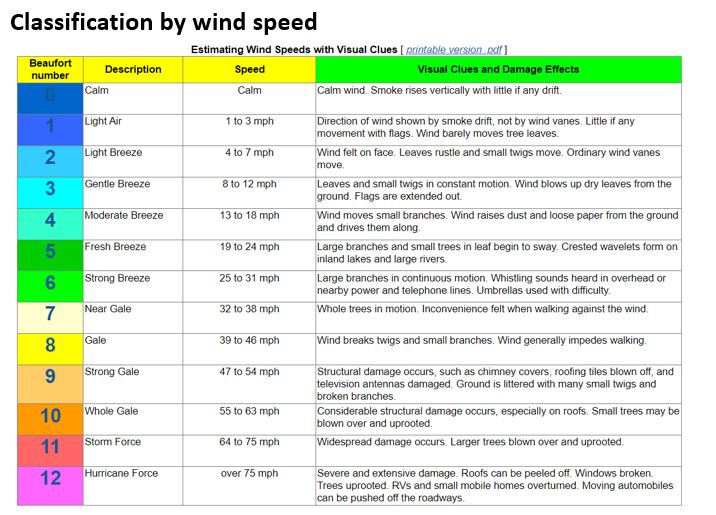
Leftmost color: In many cases, a color is assigned to each section so that the wind speed section can be recognized at a glance.
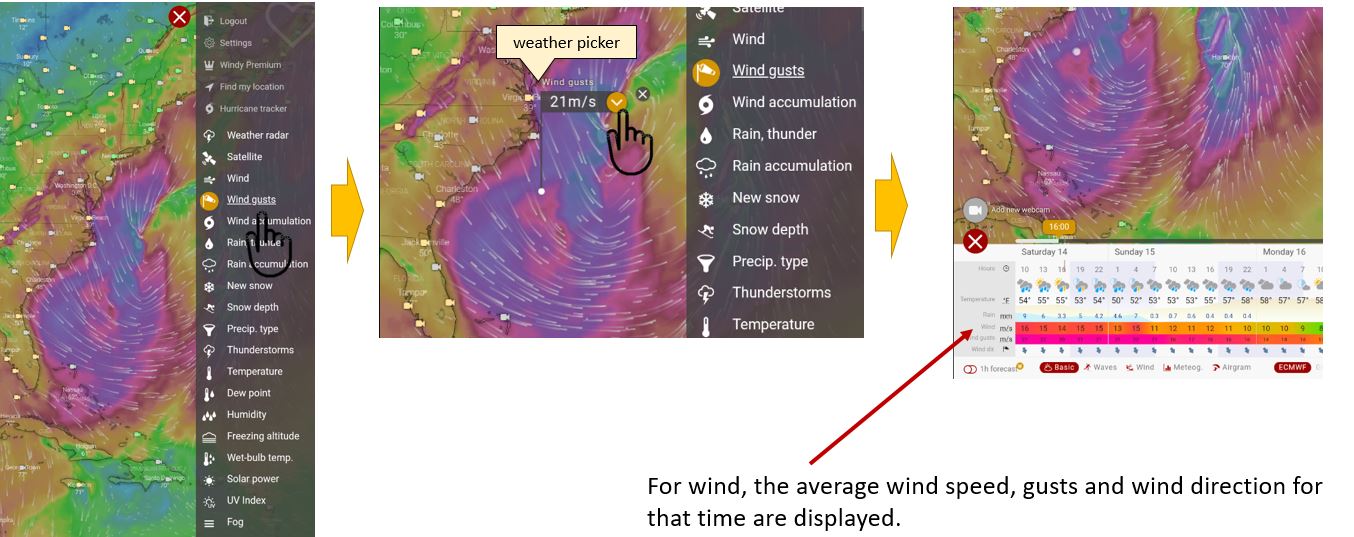
Layer wind gusts
Check before going windsurfing, kitesurfing or sailing.
If you press the wind layer and tap the place you want to check on the map, a weather picker will appear and you can see the strength of the wind gusts like ” 21m/s “.
You can see the weather and details by tapping the orange icon on the side.
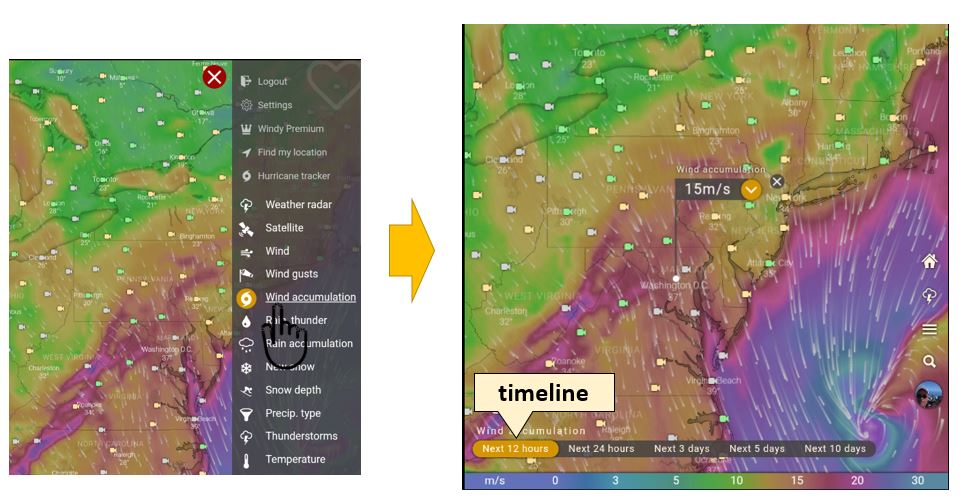
Layer Wind accumulation
Wind accumulation represents the maximum intensity forecast for gusts over the next 10 days.
Essentially, each point on the map represents the strongest or maximum winds predicted for that location over the next 10 days.
This feature is especially useful for tracking hurricanes and other high wind events.
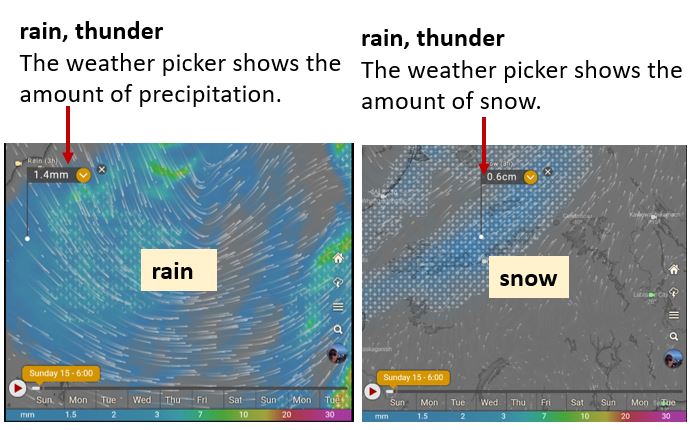
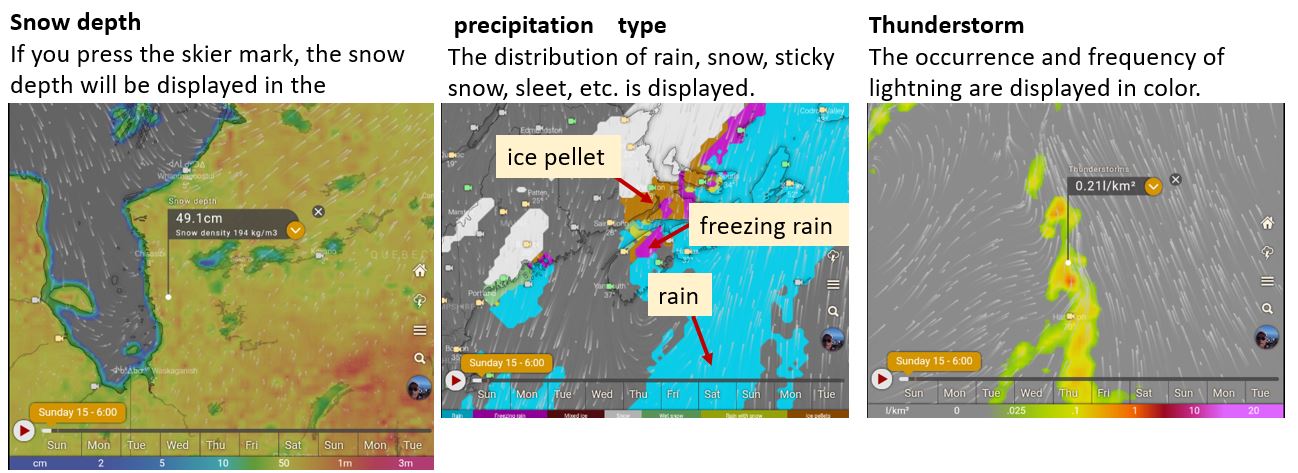
Windy Layer rain, thunder
Layers Rain and thunder are a combination of rain/snow accumulation over the past 3 hours and a forecast of lightning density.
“Rain, Thunder” includes “Rain, Thunder”, “Cumulative Rainfall”, “New Snow”, “New Snow Depth”, “Precipitation Type”, and “Thunderstorm”.
In “rain, thunder”, the precipitation type is displayed as no symbol rain, snow=*, or sleet=!.
Strength is displayed by different colors.
“Accumulated rainfall” and “Fresh snowfall” can display the (expected) cumulative rainfall of “next 12 hours/24 hours/3 days/5 days/10 days”.
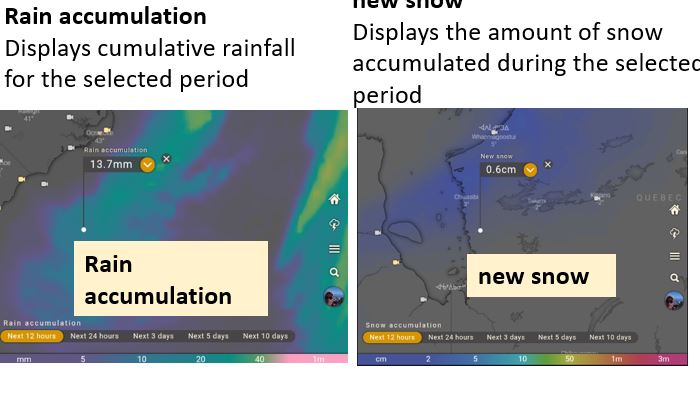
“Snow depth” is the depth of snow.
Actual snow depth is affected by many factors such as topography and city.
“Snow depth” can be measured, but “new snow” = “snowfall” cannot be measured directly.
‘Precipitation Type‘ displays rain, frost, mixed ice, snow, wet snow, rain with snow, and ice pellet distribution.
A ‘thunderstorm‘ is defined as the number of flashes of light over an area of 1 square kilometer during the day.
The unit used to express the intensity of a thunderstorm is “l/km2”.
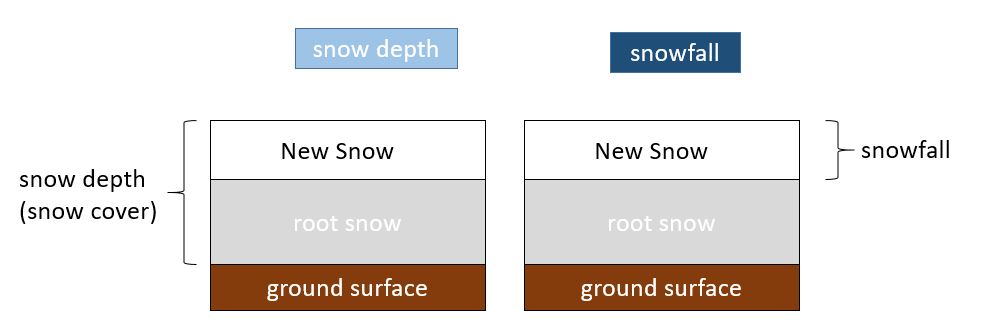
Difference between snowfall amount and snow depth (snow cover amount)
The difference between snowfall and snow depth (snow cover) is shown in the figure below.
“Snow depth” refers to the thickness of the snow cover at a certain point in time.
In meteorological observation, laser beams are used to measure the height from the ground to the snow surface, and the snow depth is recorded.
On the other hand, unlike rainfall, there is no way to directly measure “snowfall”, so the hourly increase in snow depth is called “snowfall” in meteorological observations.
In plain areas where there is no root snow (old snow), the amount of accumulated snow equals the amount of snowfall.
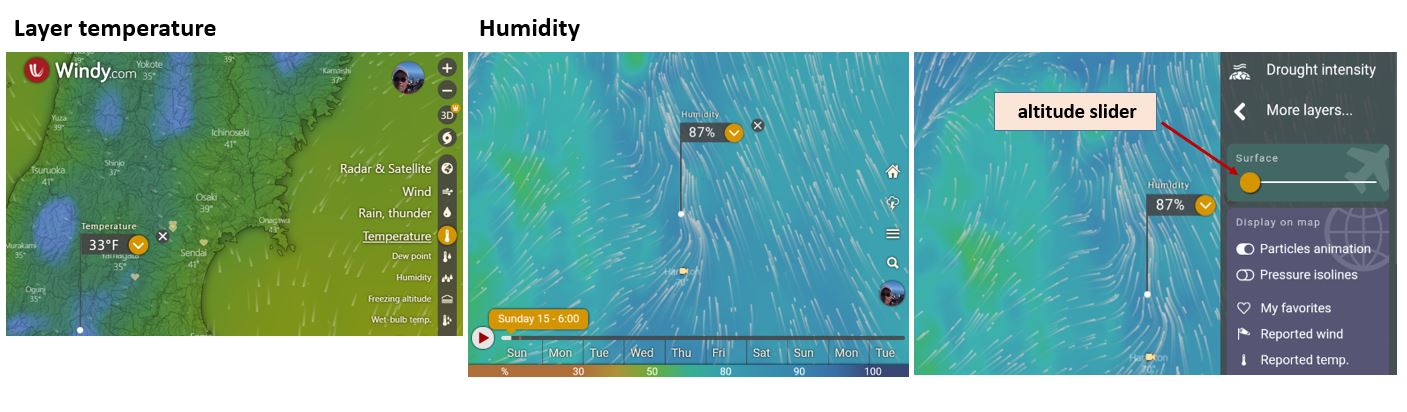
Layer temperature
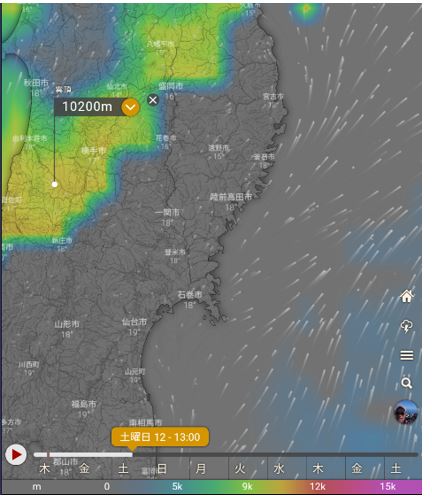
The “Temperature” layer has “Temperature”, “Dew Point”, “Humidity” and “Frozen Level“, “Wet-bulb temp”
For “Temperature” and “Humidity” as well as “Wind”, you can adjust the altitude slider on the right side to display the temperature in the sky.
The “dew point” is the temperature at which the water vapor contained in the air becomes a liquid (fog) when the air is cooled.
“Freezing altitude” means the altitude at which water freezes.
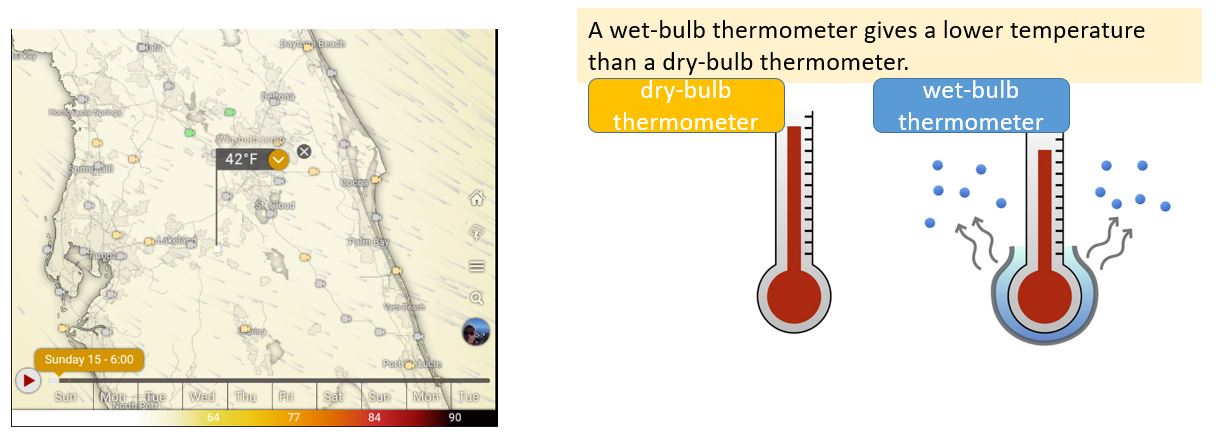
8.Layer Wet-bulb temp
The temperature measured by wrapping the thermometer sensor in a damp cloth and exposing it to air to avoid direct sunlight.
The temperature indicated by the wet bulb of a psychrometric hygrometer.
The wet bulb loses latent heat as the water evaporates, and the temperature drops.
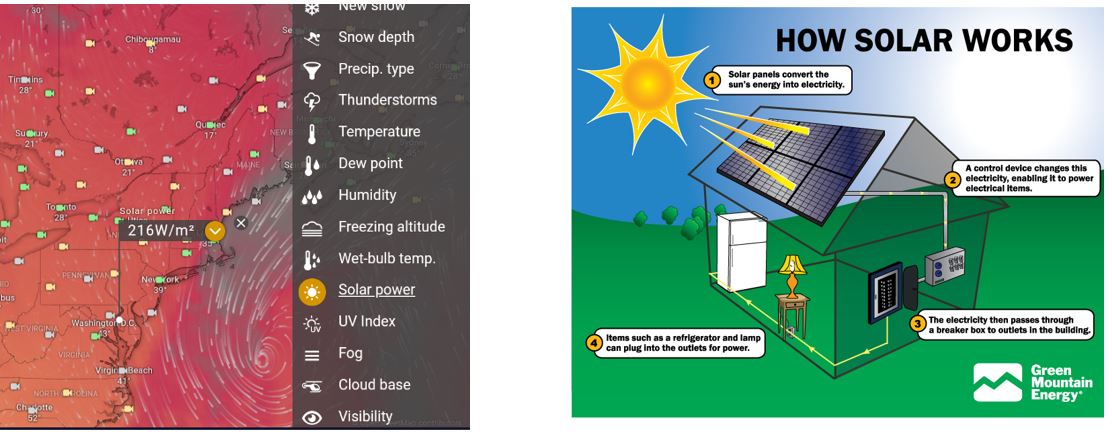
Layer Solar Power
Layer The meaning of solar power generation is the amount of solar radiation.
It measures the amount of radiant energy from the sun.
Units are kilowatts per square meter (kW/m2) or watts per square meter (W/m2)
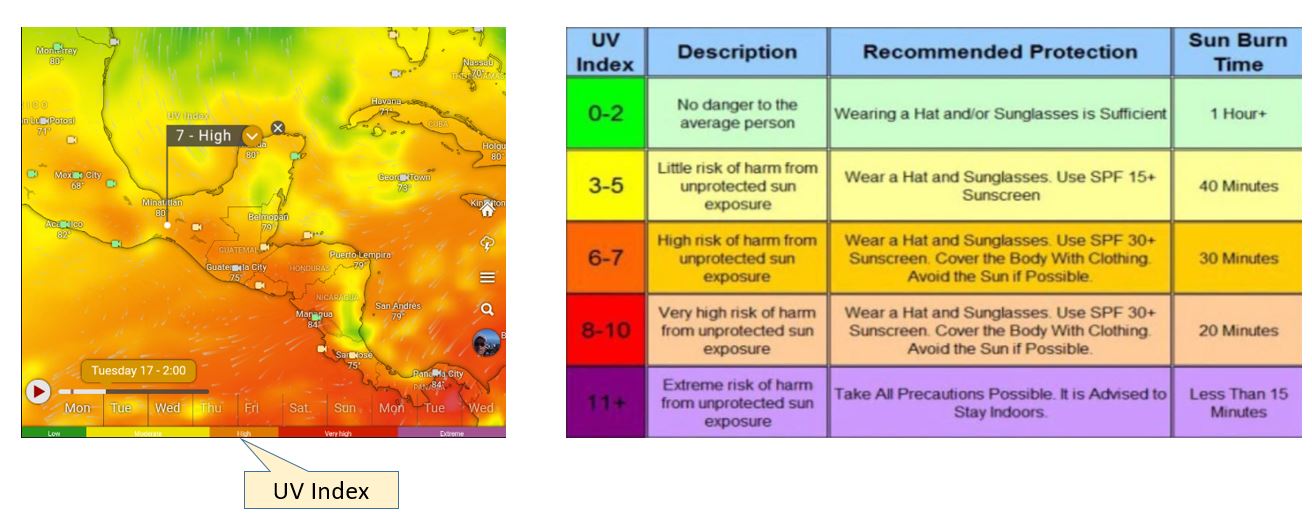
Layer UV Index
The UV index (ultraviolet index) is an index designated by the World Health Organization to clearly indicate the degree of influence of ultraviolet rays on the human body.
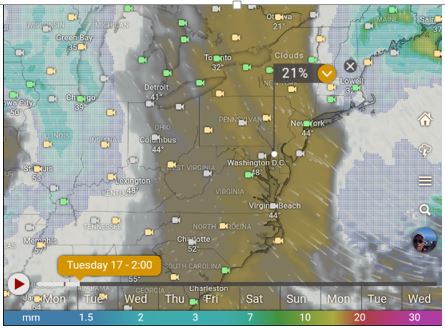
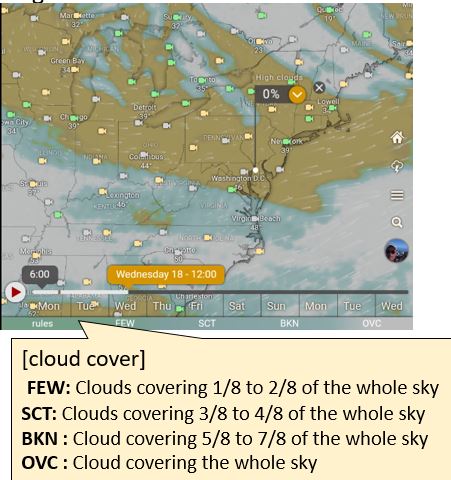
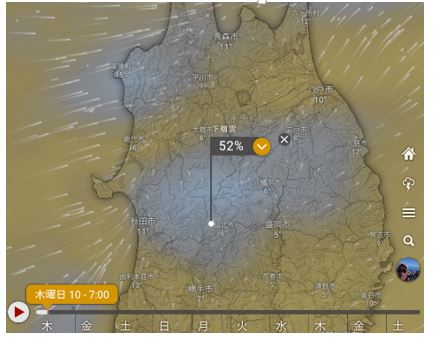
Layer cloud
The layer “clouds” can display weather information such as “clouds” that display all layers and “Low clouds” (100-2000m above), “Mid-level clouds” (2000-7000m), “High clouds” (over 7000m), “Fog“, “Cloud top“, “Cloud base” (Cloud bottom), “Visibility“, “CAPE index”
“Clouds”
Cloud cover is quantified in % and displayed in gray to white shades.
The amount of rainfall displayed by the dots is color-coded by a color-coded bar displayed below the time slider.
“High clouds“
Clouds that occur in high altitudes from7,000m to 13,000m.made of ice particles.
Cirrostratus, cirrus, and cirrocumulus are high clouds
“low clouds“
Clouds that extend below 2000m.
Stratocumulus is a cloudy cloud that often appears in the low sky.
Sometimes you can see streaks of light through the clouds.
Stratus clouds are the lowest haze-like clouds, Sometimes it covers low mountains.
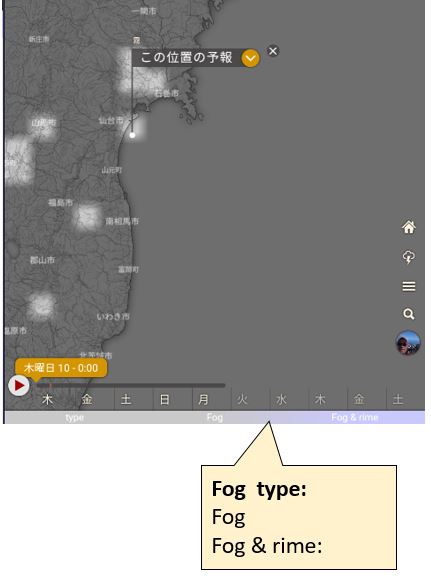
“Fog“
Fog generation status is displayed.
“Cloud top“
It is the highest part of the cloud.
Since it is at the top of the sea of clouds,there are many sunny days at higher altitudes.
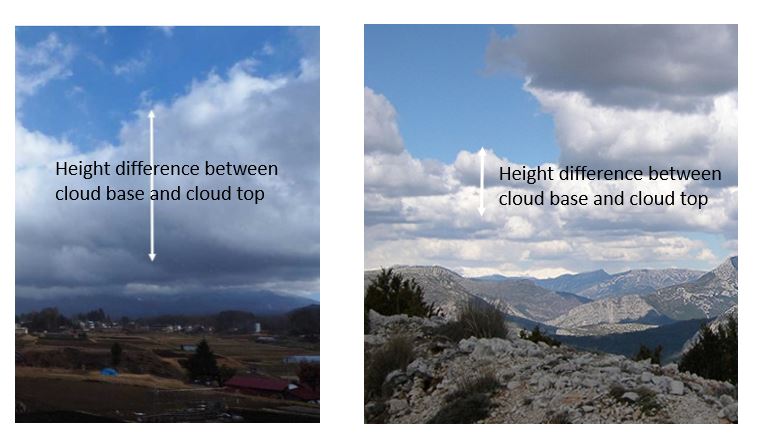
“cloud base “
It is the lowest point of the cloud.
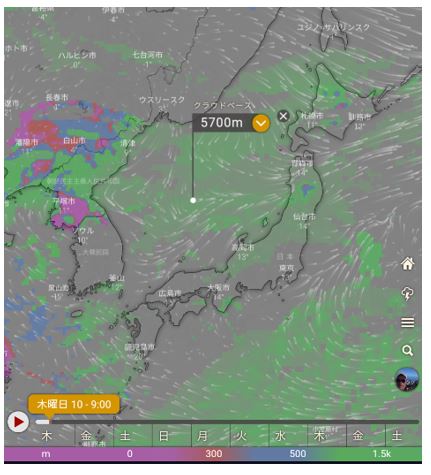
If there are many clouds at the foot of the mountain, the height difference between the cloud base and the cloud top will be large.
This means that the clouds will thicken.
When that happens, the sun’s light cannot pass through, and the bottom of the cloud turns dark.
When you see these cloud features, there is a blizzard on the mountain.
Due to the poor visibility and the risk of hypothermia, activities above the forest line should be avoided.
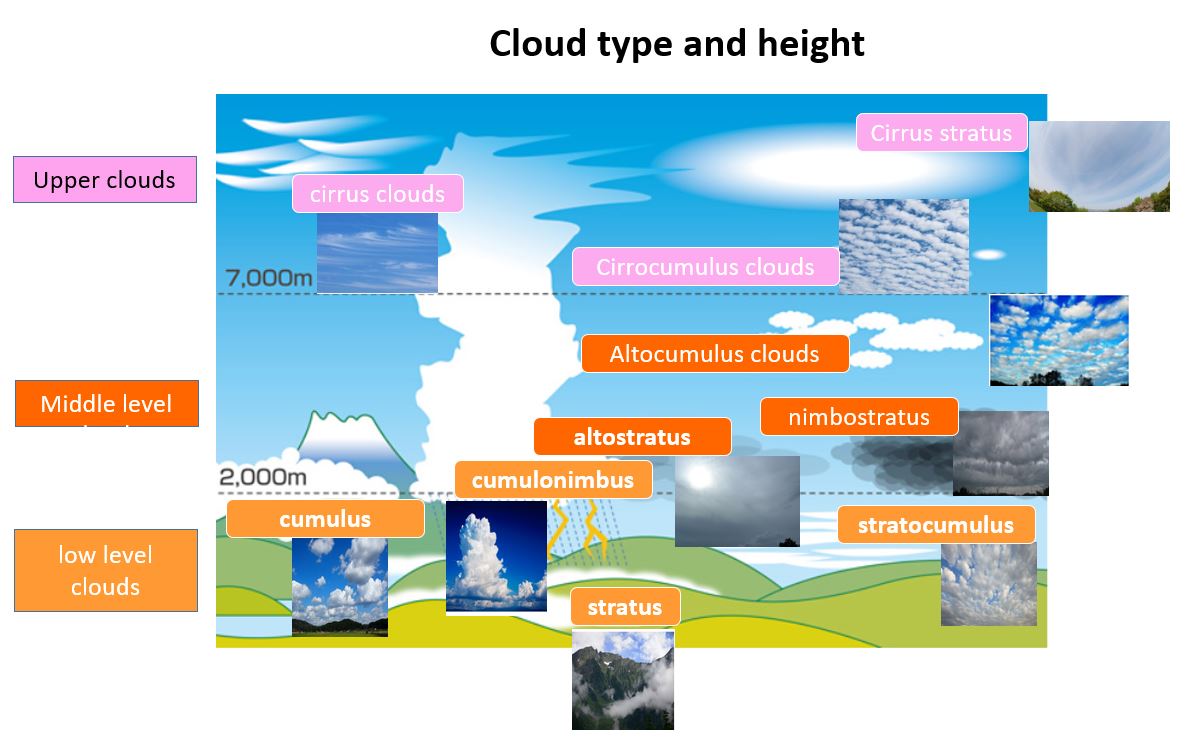
Cloud type and height
Clouds are divided into three groups, high clouds, middle clouds, and low clouds, depending on the height at which they tend to form.
High clouds include cirrus, cirrocumulus, and cirrostratus.
Intermediate clouds include altocumulus, altostratus, and nimbostratus clouds.
Low clouds include stratocumulus, cumulus, stratus, and cumulonimbus clouds.
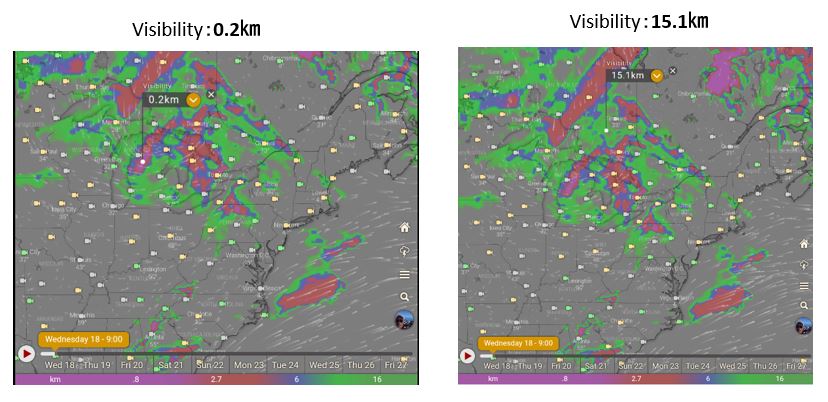
Layer Visibility
Visibility is the maximum distance at which an object can be clearly seen with the naked eye.
When the visibility is simply referred to, it often refers to the horizontal visibility, which is the visibility in the horizontal direction.
Visibility changes and their causes
In meteorology, when the visibility becomes smaller than usual, it is called a visibility disorder, and representative examples include fog, haze, haze, snow, haze, and yellow sand.
Visibility is often obstructed by rain and snow, but man-made air pollutants (particulate matter) also have a large impact.
Under these conditions, there are whiteouts that are invisible due to fog, wind and snow, and brownouts that are invisible due to sand smoke.
Changes in Visibility and Their Causes
In meteorology, when the visibility becomes smaller than usual, it is called a visibility disorder, and representative examples include fog, haze, snow, haze, and yellow sand.
Visibility is often obstructed by rain and snow, but man-made air pollutants (particulate matter) also have a large impact.
There are whiteouts and brownouts that become invisible due to fog, snow, and dust as states that become invisible under these conditions.

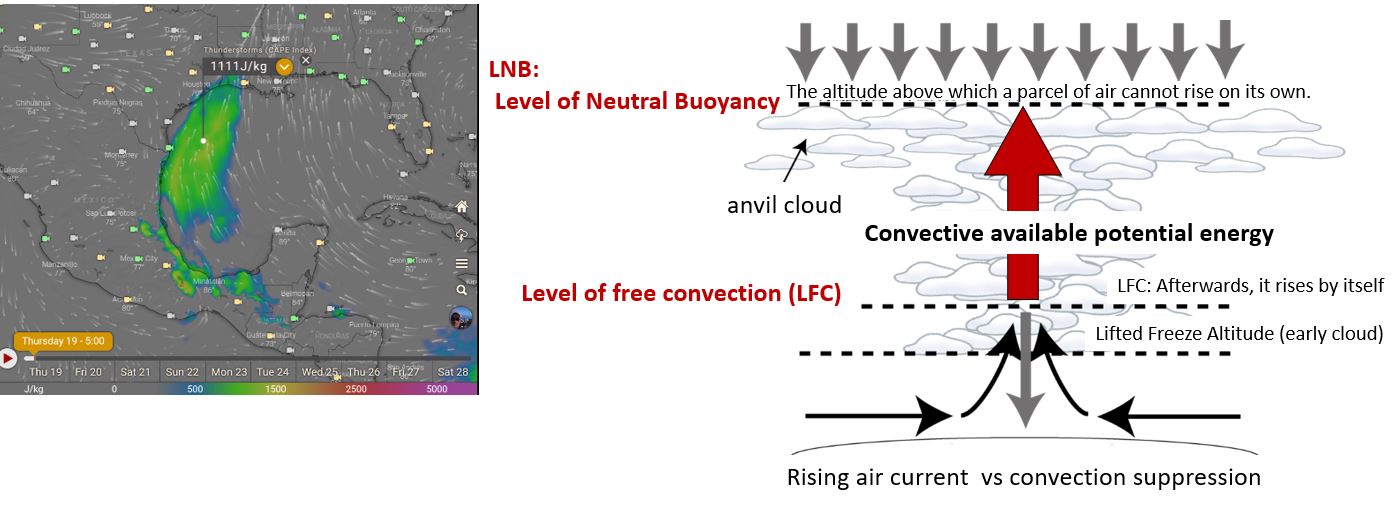
13.Layer CAPE Index(Convective Available Potential Energy )
CAPE is effectively the positive buoyancy of an air parcel (mass of air) and is an indicator of atmospheric instability, which makes it very valuable in predicting severe weather.
Values from 1000 to 2000 can indicate forming of moderate thunderstorms, and over 2000 severe ones.
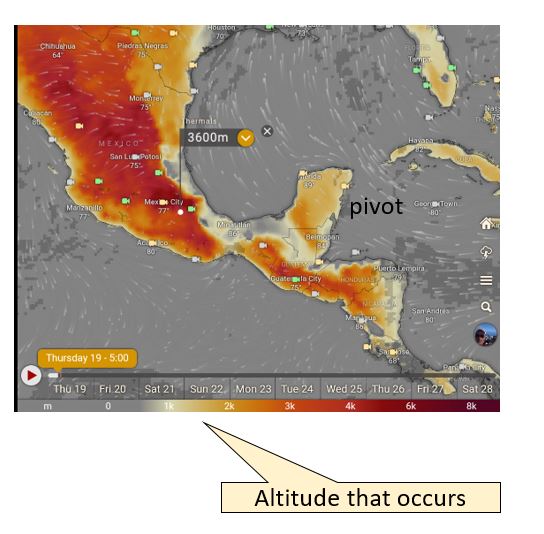
Layer Thermals
Thermal occurrence and altitude, and cumulus cloud occurrence, map color indicates maximum AMSL.
*AMSL:Above mean sea level
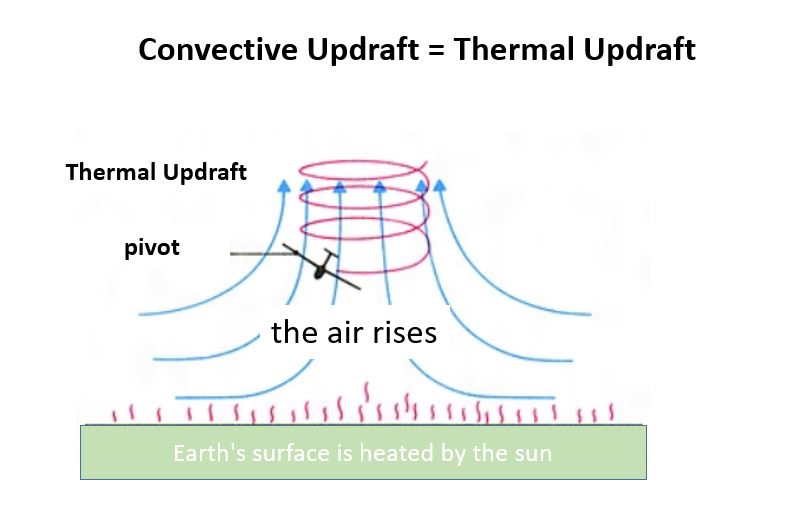
What is convective updrafts?
Updrafts generated by atmospheric convection are called convective updrafts.
When you go to the sea in the summer, you can see large cumulonimbus clouds floating on the sea. This is because the air warmed on the sea surface becomes an updraft, rises, and creates a cumulonimbus cloud.
Such cumulonimbus clouds are generated by convective updrafts. It is also called a thermal updraft because it is an updraft generated by solar heat.
In the field of sky sports such as gliders and paragliders, rising air currents are called thermals, but this is the English Thermal, that is, only thermal rising air currents.
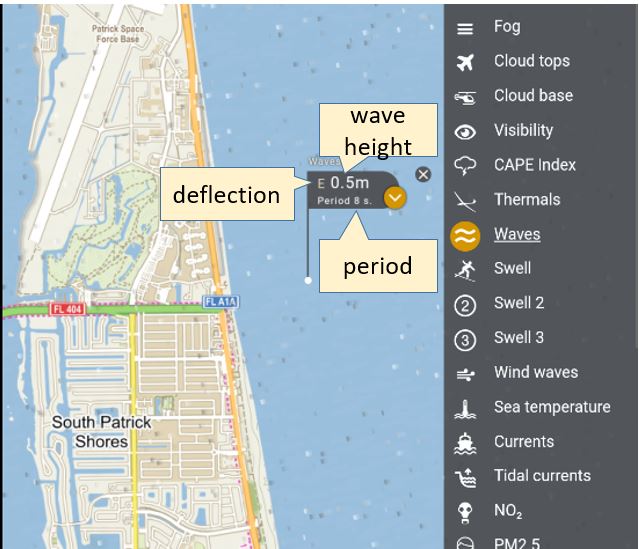
Layer wave
The definitions of waves, swells, swells 2, swells 3, and wind waves in the weather layer items of Windy.com are as follows.
Waves: Significant wave height and its period of all wave types combined (swell and wind waves). Close to the shoreline, the actual height is influenced by the shape of the sea bottom.
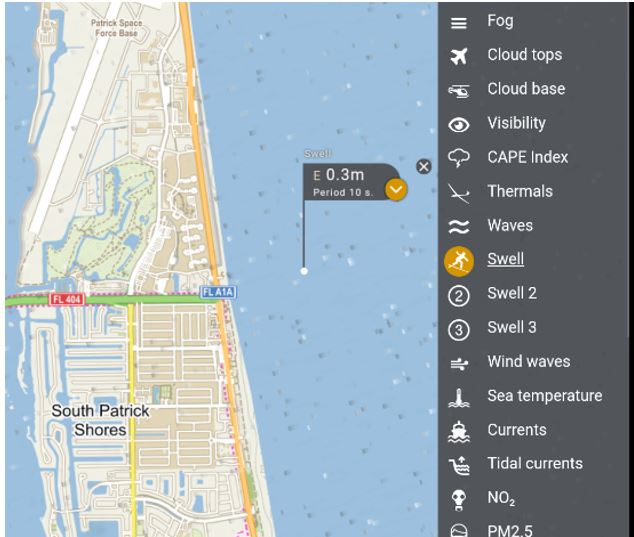
Swell1: A swell consists of wind-generated mechanical waves that are not significantly affected by the local wind at that time. They have been generated elsewhere and some time ago, usually travelling long distances.
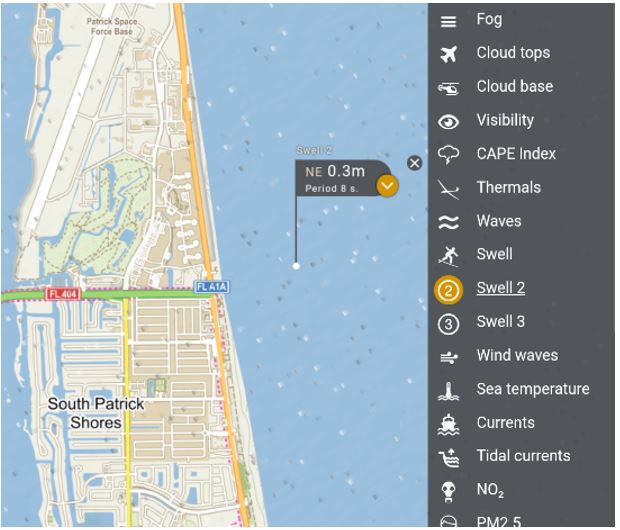
Swell2: Secondary swell is produced also by winds far away but in other places than Swell1. It has different heights, directions and periods than Swell1.
Swell3: Another secondary swell, with different heights, directions and periods than Swell1 and Swell2. More detailed info about the swells is here.
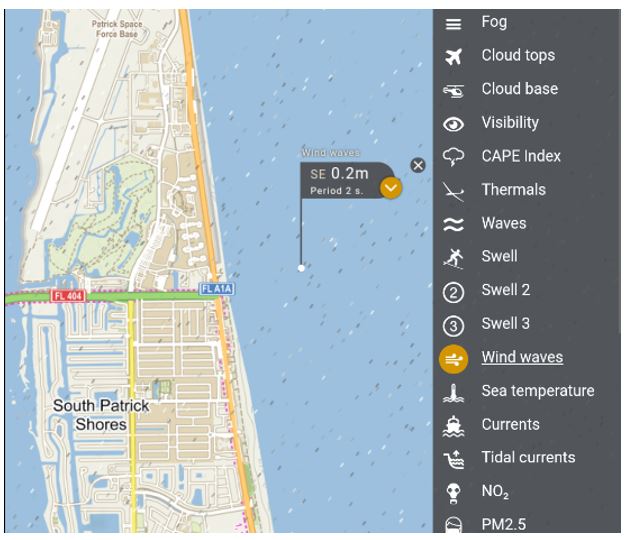
Wind waves: Wind waves, or wind-generated waves, are surface waves that occur on the free surface of bodies of water (like oceans, seas, lakes, etc.). They result from the wind blowing over an area of water surface. Wind waves are generated by the immediate local wind – which gives them the direction. After the wind ceases to blow, wind waves are called swells.
Quote:Description of weather overlays
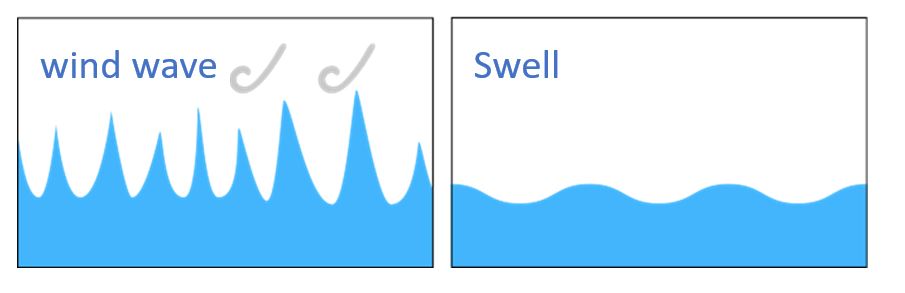
What is wave ?
There are two types of waves: wind waves and swells.
①Wind waves: Waves caused by the wind are called wind waves
② Swell:Waves caused by winds in other sea areas are called swells. A typical example of swells is waves caused by the aftermath of a storm. Swells have a longer period and longer wavelength than wind waves.
Examples of wave, swell, swell 2, swell 3, wind waves
wave is a combination of wind waves, waves, and the effects of topography.
Swell is a swell caused by wind waves generated in the distance,The mark is a surfing mark.
swell 2 is a swell caused by wind waves generated in a distant place different from the swell 1.
Wind waves are caused directly by the wind
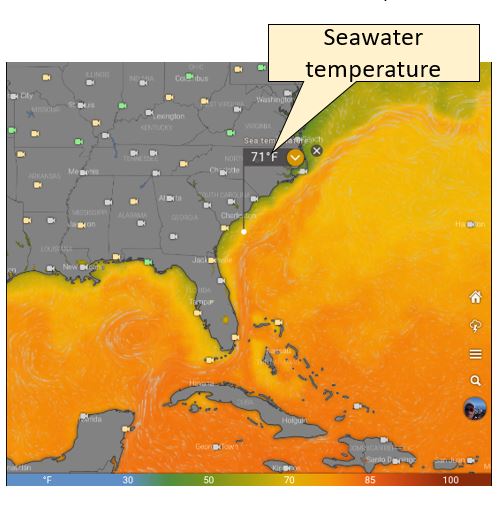
Layer Seawater temperature
Sea surface temperature as estimated for actual time. Close to the shoreline, the actual value is influenced by the shape of the shoreline and the sea bottom, and also by wind and waves.
As the depth increases, the water temperature usually decreases.
However, near the surface of the sea, there is a layer with a small change in water temperature in the depth direction.
This layer is called the surface mixed layer.
In the case of Japan, in the summer, seawater near the surface of the sea is warmed by solar radiation, The surface mixed layer becomes thinner because the temperature difference between the sea surface and the lower layer increases.
In winter, seawater is cooled on the surface of the sea, and the upper and lower layers of water are actively stirred by the wind blowing over the sea, forming a thick surface mixed layer.
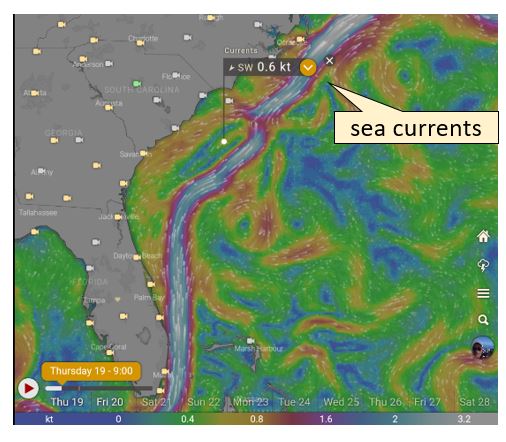
Layer current
Surface sea currents as estimated for actual time. Close to the shoreline, the actual value is influenced by the shape of shoreline and sea bottom. Also, actual surface sea currents can be influenced by the wind.
An ocean current is a large current that always flows in a certain direction in the ocean.
On the other hand, a current in which the seawater changes periodically due to the tide is called a tidal current.
*1kt=0.514m/S
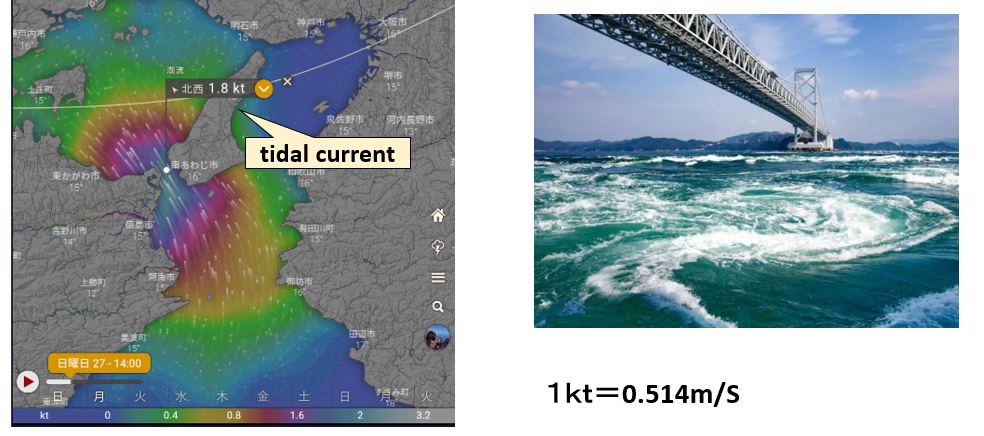
Layer tidal current
Tidal currents are the only type of current affected by the interaction by the Earth, sun and moon. When the tidal current moves toward the land and away from the sea, it rising tide . When the tidal current toward the sea and away from the land, it ebbs tide.
The flow of seawater that changes periodically due to the ebb and flow of the tide (tide) is called a tidal current.
The tidal current in the Naruto Strait in Japan reaches over 10 knots (approximately 20 km/h) at the fastest spring tide.
*1kt=0.514m/S
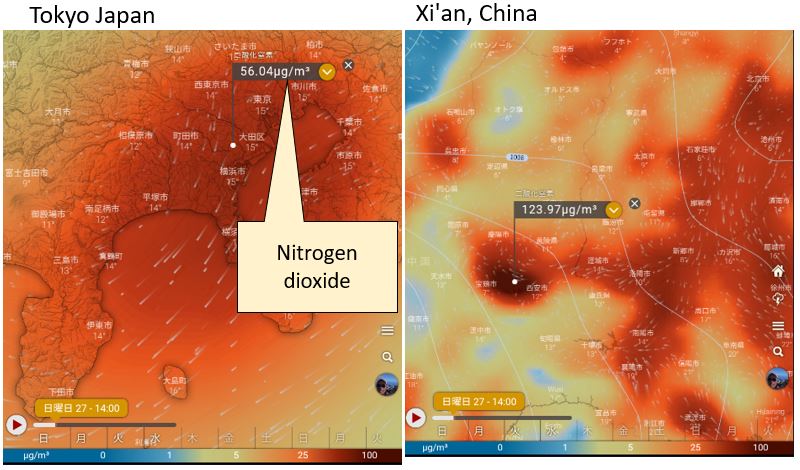
Layer Nitrogen dioxide NO₂
NO₂ is generated as a by-product in the combustion process of various substances and the manufacturing process of substances such as nitric acid.
Regarding human health effects, there is mainly an effect on the respiratory system, and environmental standards have been established, and the daily average value is within the range of 0.04–0.06 ppm or less.
「WHO global air quality guidelines」
AQG level:
The AQG level is a kind of guideline recommendation, and when governments of each country adopt it for environmental standards, etc., it is necessary to consider the situation of each region.
10μg/m3 less Annual
25μg/m3 less 24-hour
source: WHO global air quality guidelines
The image on the left is nitrogen dioxide in Tokyo, Japan, and the distribution of nitrogen dioxide concentration in Xi’an, China on the right.
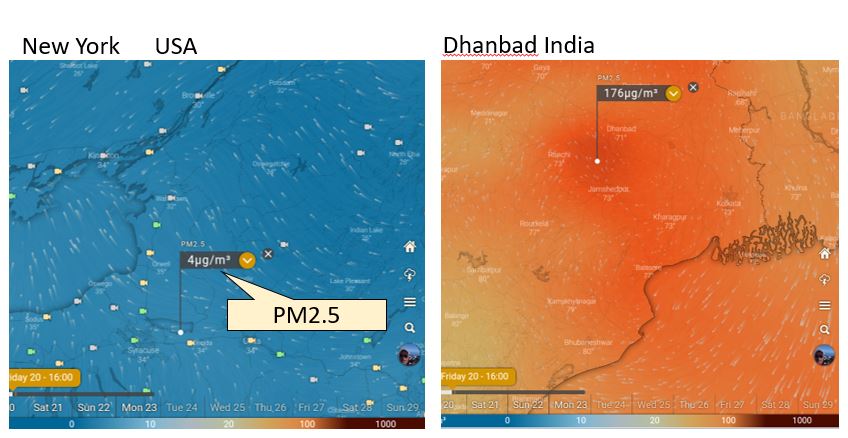
Layer PM2.5 (microparticulate matter)
PM2.5 refers to very small particles with a diameter of 2.5 μm or less (1 μm = 0.001 mm) suspended in the atmosphere.
The causes are soot and smoke from boilers and incinerators, and dust from coke ovens and mineral deposits.
Due to its small size, PM2.5 penetrates deep into the lungs when inhaled through the mouth or nose, causing various health hazards.
Yellow dust and PM2.5 are different things, and it seems that they are not related, but in fact, if the size is 2.5 micrometers or less, dust is also included in PM2.5.
「WHO global air quality guidelines」
AQG level:
5μg/m3 less Annual
15μg/m3 less 24-hour
Layer aerosol
A mixture of minute liquid or solid particles suspended in gas and surrounding gas.
Aerosol particles are called dust, fume, mist, smokedust, etc., depending on the process of their generation.
A mixture of minute liquid or solid particles suspended in gas and surrounding gas.Aerosol particles are called dust, fume, mist, dust, etc., depending on the process of their generation.
Aerosol infections are infections caused by pathogen-laden aerosols.
Aerosols can remain suspended in the air for up to three hours, so there is a risk of infection in closed spaces with high concentrations of aerosols.
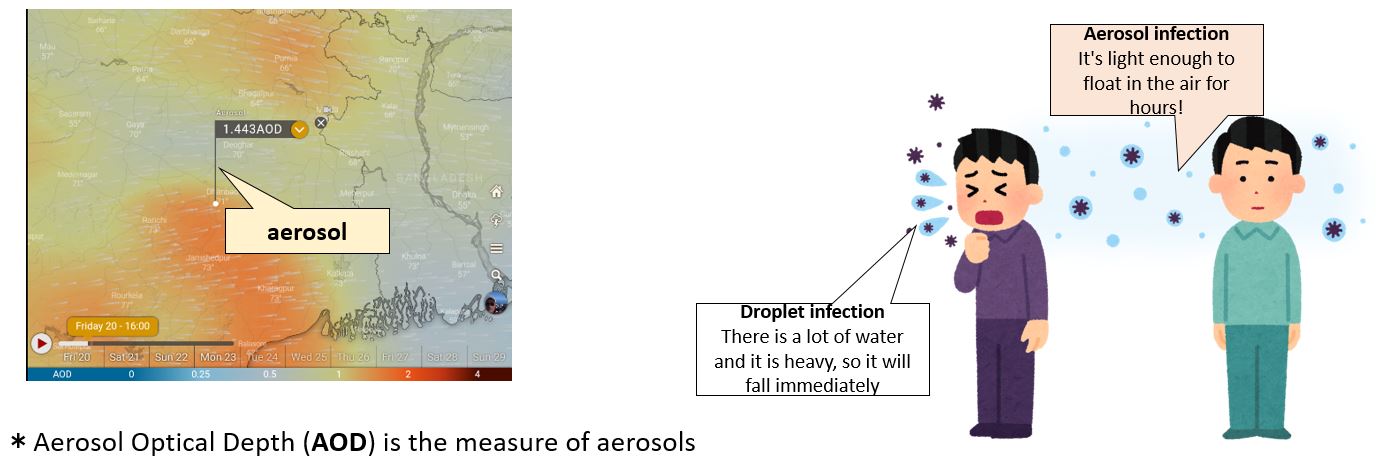
The measure of aerosols
Aerosol Optical Depth (AOD) is the measure of aerosols (e.g., urban haze, smoke particles, desert dust distributed within a column of air from Earth’s surface to the top of the atmosphere.
The rate of extinction of the light increases as AOD increases.
Typical atmospheric values are between 0.1 and 0.15.
Source: Aerosol Optical Depth Quick Guide
Difference between aerosol, SPM and PM10
SPM(Suspended Particulate Matter):
Aerosols are named according to their particle size. Above all, aerosols with a particle size of 10 μm or less are called suspended particulate matter (SPM).
Japan’s environmental standards define SPM as follows.
1)The daily average value should be 0.10 mg/m3 or less.
2)1 hour value is 0.20mg/m3 or less.
PM10 is adopted as an environmental standard of WHO. However, it includes particles that are larger than SPM due to different standards.
1)The annual average value must be 15 μg/m3 or less.
2) The 24-hour average value must be 45 μg/m3 or less.
source: WHO global air quality guidelines
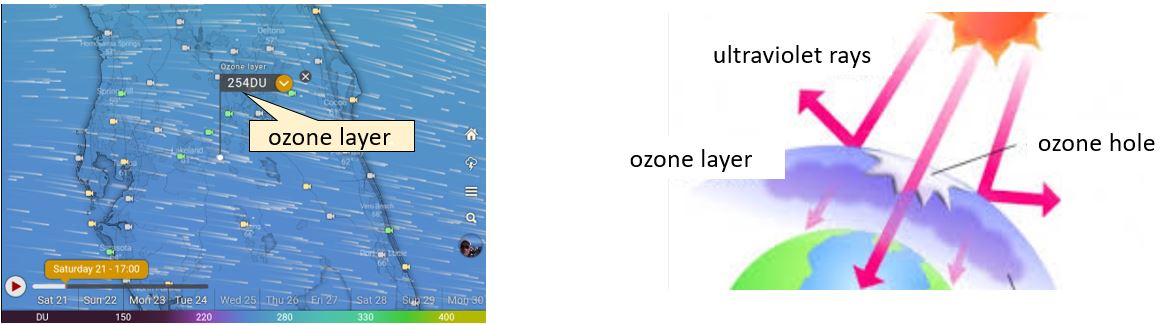
Layer Ozone
Ozone is a gas consisting of three oxygen atoms.
Approximately 90% of ozone in the atmosphere exists in the stratosphere (approximately 10 to 50 km above), and this ozone-rich layer is generally called the ozone layer.
Since part of the ultraviolet rays from the sun is absorbed by the ozone layer, generally, the lower the ozone concentration in the ozone layer, the higher the amount of ultraviolet rays on the earth’s surface. Conversely, the higher the ozone concentration, the lower the amount of UV rays on the ground.
Stratospheric ozone absorbs harmful ultraviolet radiation from the sun and protects terrestrial ecosystems.Measurements of the ozone layer are measured in (DU), with higher values representing more ozone and less UV radiation.
*The Dobson unit (DU) is a unit of measurement of the amount of a trace gas in a vertical column through the Earth’s atmosphere. 1mm thickness is 100 Dobson units.
An ozone hole is presumed to have occurred when the measured value of the ozone layer falls below 220 D.U.
Layer sulfur dioxide SO₂
Sulfur dioxide is a poisonous gas with a burnt match smell.
It is released naturally by volcanic activity and is produced as a by-product of burning fossil fuels contaminated with sulfur compounds.
The unit concentration is mg/m2.
Sulfur dioxide is colorless and has a pungent odor that irritates the eyes and throat. Breathing high concentrations of sulfur dioxide may cause breathing difficulties.
The current windy SO₂ measurement data is CAMS, which shows sulfur dioxide from the ground to the top of the atmosphere on a square meter basis rather than per cubic meter, expressed in mg/m2 as the vertical column cross-sectional area density.
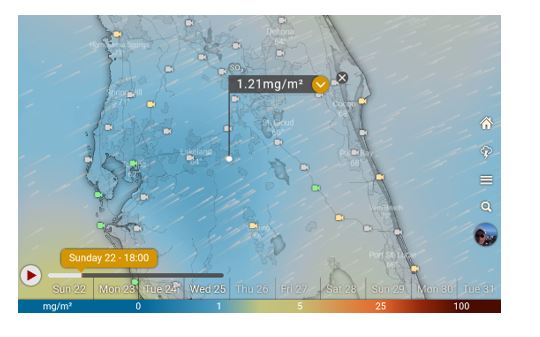
Previously, the source of measurement data was GEOS-5 and displayed “Surface SO2”, but now it has been changed to CAMS.
CAMS :Copernicus Atmosphere Monitoring Service
GEOS-5: Goddard Earth Observing System Model, Version 5
Reference article:
「WHO global air quality guidelines」
AQG level:
40μg/m3=0.04mg/m3 less 24-hour
source: WHO global air quality guidelines
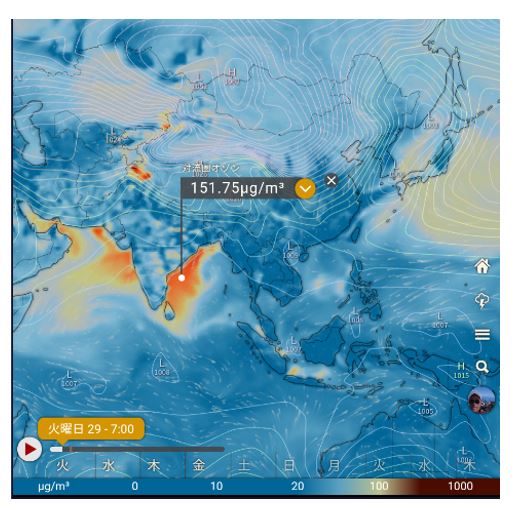
Layer tropospheric ozone (photochemical oxidant)
Ozone generated in the troposphere is “bad” ozone that damages living organisms.
Tropospheric ozone (photochemical oxidant) is also famous as an indicator of photochemical smog.
Atmospheric ozone can be divided into “stratospheric ozone” and “tropospheric ozone”. While “stratospheric ozone” protects human health from ultraviolet rays, “tropospheric ozone” is an air pollutant. As such, it is detrimental to human health and plants.
Weather conditions that tend to increase oxidant concentration are
①Strong sunlight.
②High temperature (daily maximum temperature is 25°C or higher)
③Weak wind (4m/s or less) stable atmosphere
「WHO global air quality guidelines」
AQG level:
60μg/m3 less 6month
100μg/m3 less 8-hour
source: WHO global air quality guidelines
High oxidant concentration may irritate the eyes and throat, resulting in symptoms such as stinging eyes and sore throat.
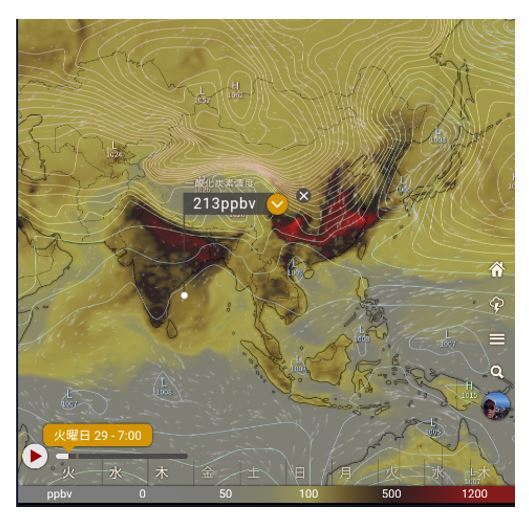
Layer monoxide concentration (CO)
Carbon monoxide is a colorless, odorless, tasteless gas that is slightly less dense than air.
Tropospheric CO concentration levels are measured by a system called parts per billion volume (PPBV).
If the concentration in the air rises to 0.02% (200ppm), headaches will occur, and if the concentration rises further, poisoning symptoms such as nausea and dizziness will progress, and in the worst case, death.
Windy CO data: Carbon monoxide (CO), unlike CO2 and CH4, has a small contribution to the greenhouse effect and is not a greenhouse gas.
However,it is closely related to the generation and extinction of CH4 and ozone in the atmosphere, and is a gas that plays an important role in atmospheric chemistry, indirectly contributing to the greenhouse effect and global warming.
「WHO global air quality guidelines」
AQG level:
4mg/m3 less 24-hour
3.43 ppm less
source: WHO global air quality guidelines
1ppm=1000 PPBV =1.1646757 mg / m3
Units: ppm and ppbv
“ppm” is a unit made by taking the first letter of English (parts per million) meaning one millionth. Like % (percentage), it is a concept of a ratio with units of 1/1,000,000.ppm is used as a unit for the concentration of gaseous air pollutants (NO2, SO2, CO, OX, etc.) in the atmosphere.
Normally, it is simply written as ppm, but it may be written as ppmV when emphasizing that it is a volume concentration (Volume).
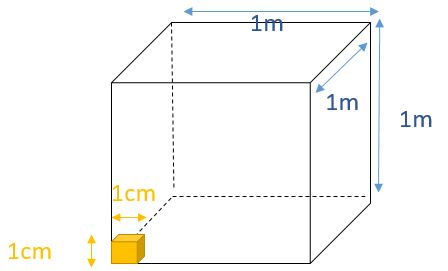
When 1cm3 of gas is contained in 1m3 of air, 1m3 = (100cm)3 = 1,000,000cm3 = 106cm3, so the volume ratio is 1/1,000,000 and is expressed as 1ppm.
1ppm is the concentration when a small box-sized gas with length, width and height of 1cm is placed in air of size of 1m each in length, width and height.
If the concentration level is low and the ppm unit is extremely small, the unit ppbv (parts per million volume), which is three orders of magnitude smaller than ppm, is used.
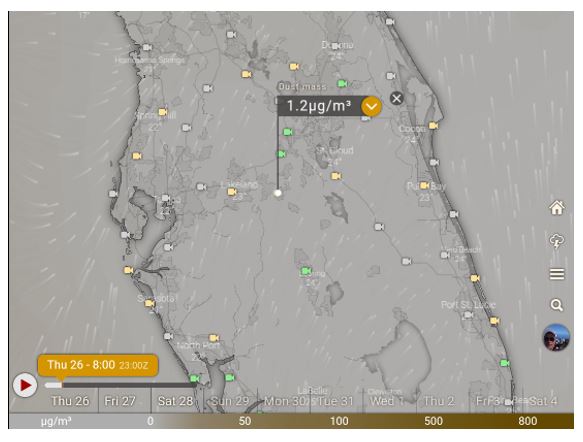
Layer dust mass
Airborne Dust is generally composed of atmospheric particles that originate from a variety of sources, including soil, weather-lifted dust, volcanic eruptions, and air pollution.
Dust concentration levels are expressed in µg/m3 per cubic meter of air.
Dust is defined by the International Organization for Standardization as “solid suspended matter with a particle size of less than 75 μm”.
Smoke and Soot is generated when things are burned, etc.
In Japan’s Ministry of Health, Labor and Welfare “Guidelines for Dust Countermeasures in Construction Work such as Tunnels
“The target level of the dust value measured by the dust meter is
2mg/m3 or less (2,000μg/m3) or less
*1ppm=1000㎎/m3=106μg/m3
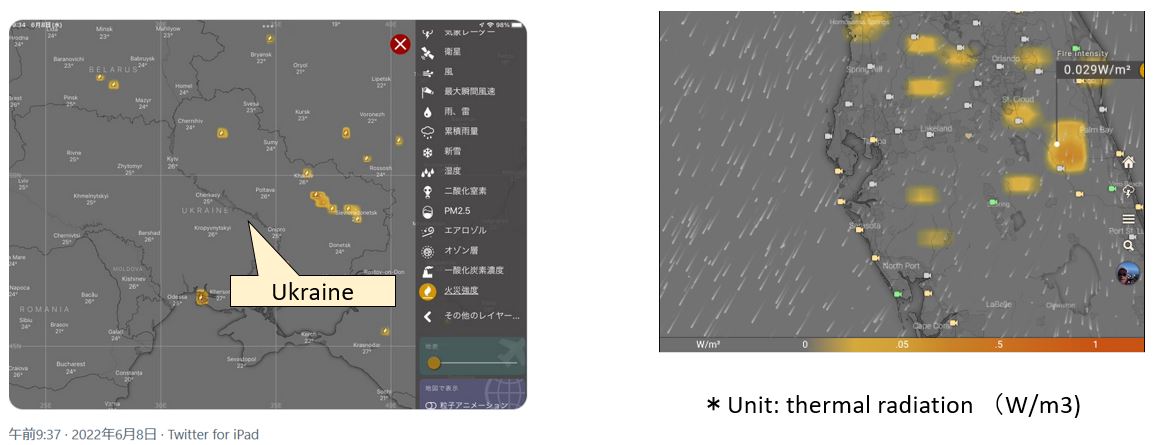
Fire intensity
This layer displays the fire intensity by measuring the radiant heat generated by the fire.
It also includes radiant heat from residential fires and volcanic eruptions.
The fires in the fiercely fought areas due to artillery fire during the Ukrainian War are also generally consistent with the parts reported in the media.
Unit is thermal radiation (W/m3)
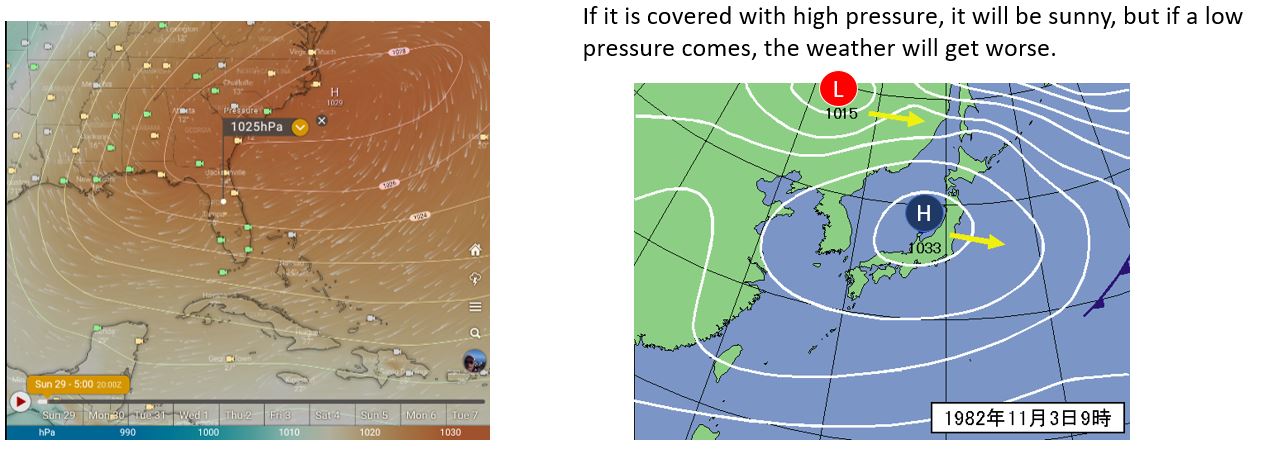
Layer Pressure (MSLP Mean Sea Level pressure)
The average atmospheric pressure at sea level.
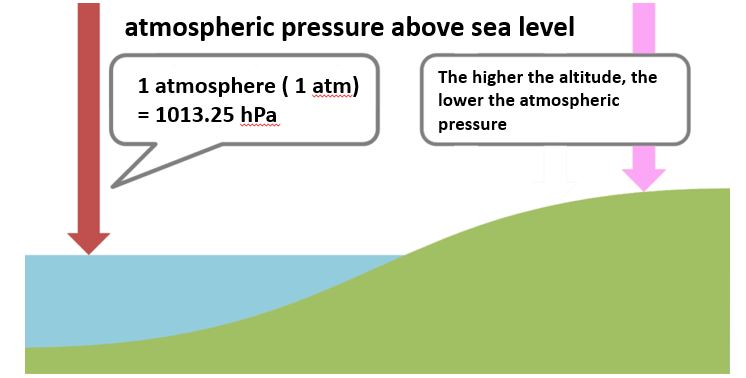
Atmospheric pressure, also called barometric pressure, is the pressure within the Earth’s atmosphere.
Standard atmospheric pressure (1 atm) is 1013.25 hPa above sea level, but since atmospheric pressure is the pressure that indicates the weight of the air above, it decreases as you go higher.
The ratio of altitude increase to pressure drop is approximately 1.2 hPa for a 10 m rise at low altitudes, which is calculated to be about 0.5 atmospheres at an altitude of 5,500 m and about 0.3 atmospheres at the summit of Everest.
hPa (hectopascal) is used as the unit for atmospheric pressure. h (hecto) means 100 and 1hPa equals 100Pa.
the magnitude of the atmospheric pressure
Atmospheric pressure is 1013.25 hPa at sea level, and the higher the altitude, the thinner the atmospheric layer and the lower the atmospheric pressure.
This atmospheric pressure above sea level (1013.25 hPa) is called 1 atmosphere or 1 atm (atom).
It is said that atmospheric pressure decreases by 1 hPa for every 10 m rise.
At the summit of Mt. Fuji, the highest mountain in Japan, the pressure is about two-thirds of the sea level (about 0.7 atm).
Difference between high pressure and low pressure
A high pressure is a place where the pressure is relatively higher than the surroundings, and there is no rule that it is a high pressure because it is over ◯◯ hPa.
A low pressure area, on the contrary, is a place where the atmospheric pressure is relatively low compared to its surroundings.
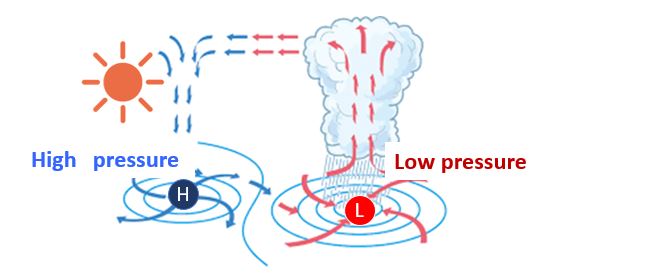
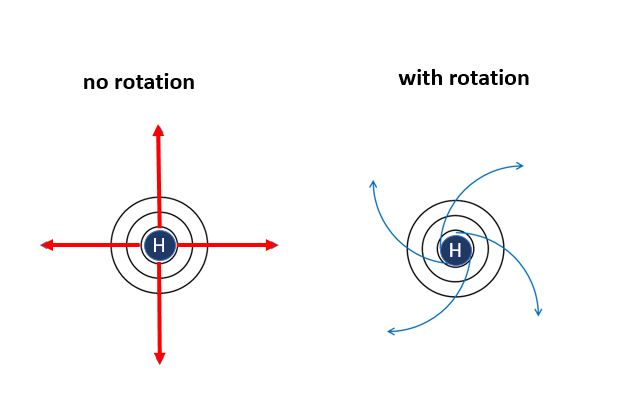
In areas covered by high pressure, descending air currents occur, clouds are less likely to form, and the weather is good. By the way, high pressure winds blow clockwise.
A low pressure system creates an updraft in which air moves upward from the ground. Low pressure where this rising air current occurs is a state where clouds are likely to form. The stronger the updraft, the stronger the clouds and the more intense rain and thunderstorms. Low pressure winds blow counterclockwise.
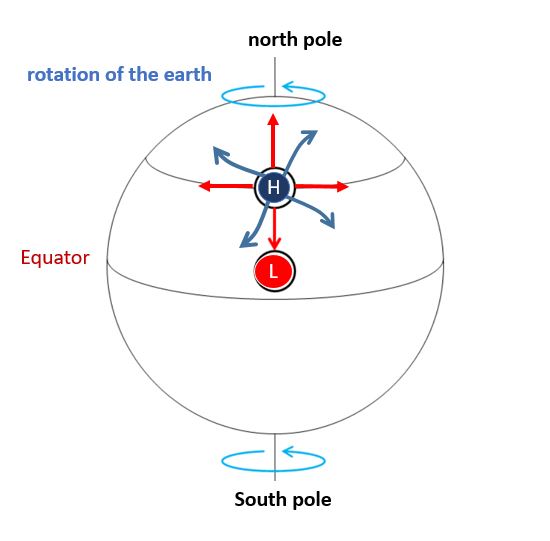
Why do high pressure systems rotate clockwise? “Coriolis force”
If there is no influence of the rotation of the earth, the wind from the high pressure will blow out straight, but in reality it will turn to the right and rotate clockwise due to the action of the rotation (Coriolis force).
In the case of low pressure, it rotates counterclockwise.
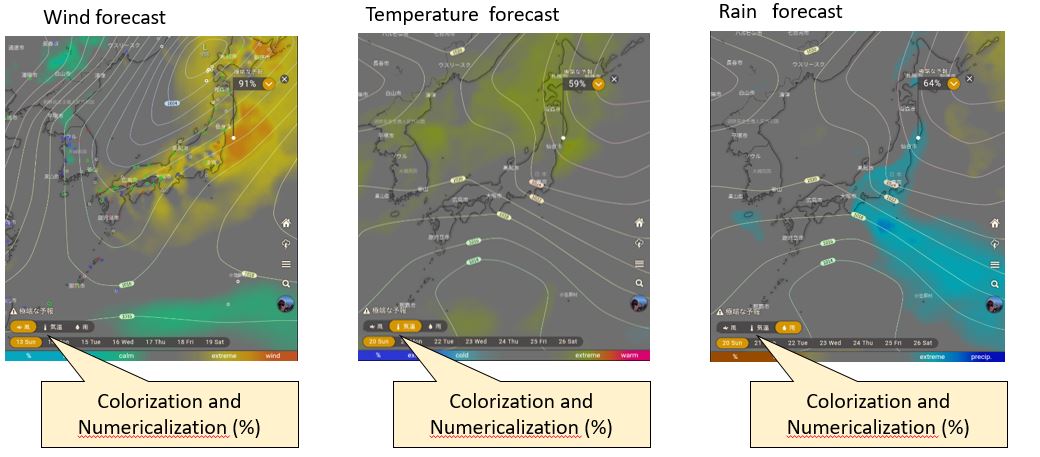
Layer Extreme forecast
A layer that predicts extreme abnormal weather in different colors and percentages for each wind, temperature, and rain.
Layer Weather warnings
Weather alerts are issued by national meteorological agencies in the form of “CAP alerts“
However, it currently covers only some regions such as Europe, the United States, and Russia.
Common Alerting Protocol?
The Common Alerting Protocol (CAP) is an XML-based data format for exchanging public warnings and emergencies between alerting technologies. CAP allows a warning message to be consistently disseminated simultaneously over many warning systems to many applications, such as Google Public Alerts and Cell Broadcast. CAP increases warning effectiveness and simplifies the task of activating a warning for responsible officials.

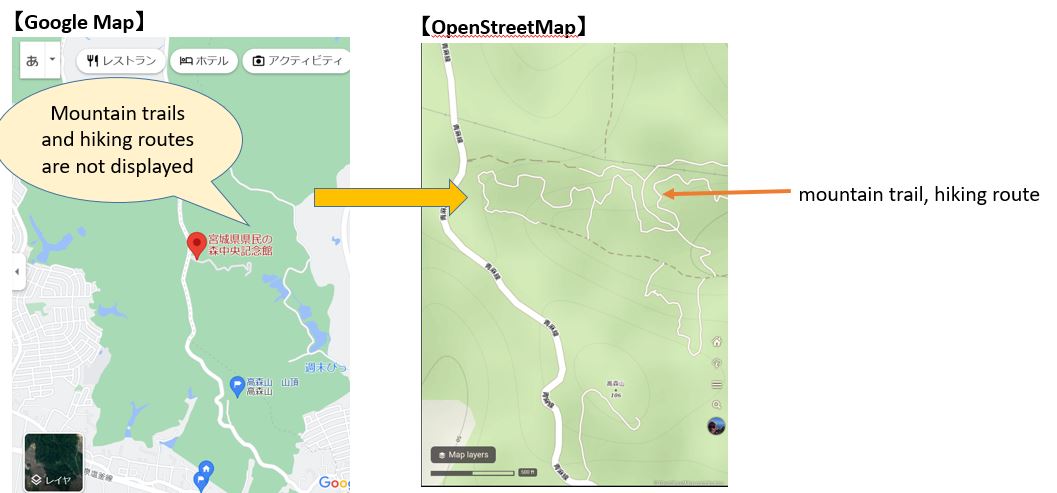
layer Outdoor map
It can be used as a hiking map using Open Street Map, and mountain trails and hiking routes that are not displayed on Google Maps are also displayed in an easy-to-understand manner.
*OpenStreetMap:
OpenStreetMap is a collaborative project to create a freely available and editable world map.
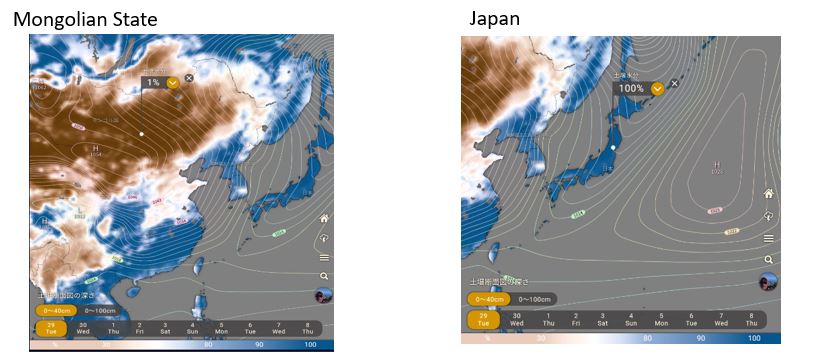
Layer Soil moisture
Readily available soil water represents the amount of water available to plants as a proportion of the maximum soil water content that can be permanently held within the given soil column.
Units are % where 0% represents no water available to plants (i.e. wilting point) and 100% represents water content held in the soil after excess water has drained away (i.e. field capacity).
In general most plant species cannot survive values close to 0%, at values below 30% visible signs of water stress will be apparent on most plant species and at values below 50% (i.e. stress point) plants start to be limited by soil water availability.
Display of soil moisture
The amount of water contained in the interstices of soil is called moisture content. The amount can be expressed either by the ratio of the water content Ww to the dry weight Ws of the soil (moisture ratio) or by the ratio of the water content weight to the wet weight W of the soil (moisture content). Water content is usually expressed as moisture ratio .
Moisture ratio of soil in its natural state is 5 to 30% for sandy soil and 30 to 80% for cohesive soil. Soil has different engineering properties depending on its water content, so it is important to know the water content ratio of the soil in order to understand the condition (property) of the soil.
The display and measurement methods of soil moisture content are not standardized, and there are various display and measurement methods.
| display | content | formula | Note |
| moisture ratio(%) | Displays moisture weight as a percentage of dry soil weight | Water weight/dry soil weight x 100w=Ww/Ws×100w is the water content, Ww is moisture ratio contained in the soil, and Ws is the weight of the dried soil | Mainly used in agricultural and civil engineering fields |
| moisture content(%) | Display the moisture weight as a percentage of the wet soil weight | Water weight/wet soil weight x 100w’=Ww/W×100w’ is the moisture content, Ww is the weight of water, and W is the weight of soil plus water. | “Soil moisture” commonly used on farms |
| pF value(Water retention of soil) | A value that expresses the degree of strength with which water in soil is attracted by the capillary force of soil | A pF meter measures the force required for a plant to absorb water from the soil. | In the case of upland fields, the pF value is usually 1.5 to 2.7 (effective water for growth). |
*植物の土壌水分利用:土壌水分は、土壌から流れ出す重力水から、土壌孔隙の毛管に保持される毛管水、土壌粒子表面に吸着される吸湿水などがある。作物の根が利用するのは、土壌間隙に蓄えられる毛管水であり、土壌構造により全体の有効水の量は大きく変化する。
*Utilization of soil moisture by plants :
Soil moisture includes gravitational water flowing out of soil, capillary water retained in capillaries in soil pores, and moisture absorption water adsorbed on the surface of soil particles. The roots of crops use capillary water stored in the soil interstices, and the total amount of available water varies greatly depending on the soil structure.
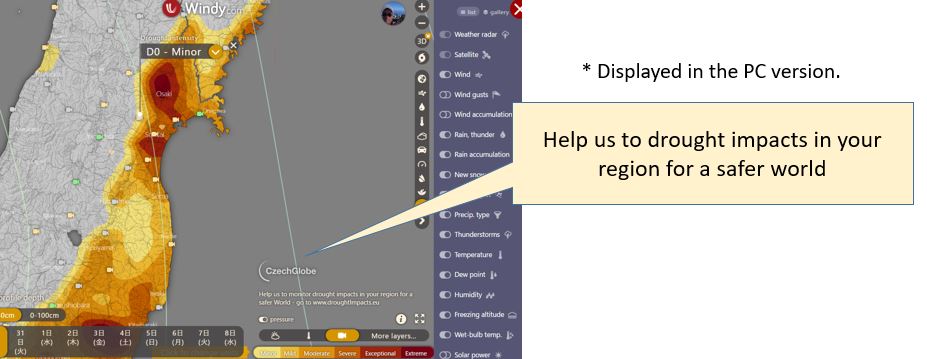
Windy joined forces with CzechGlobe (Global Change Research Institute CAS) to forecast global drought
Millions of people globally are affected by drought every year, it is a natural climate cycle, which is characterized by the lack of precipitation, resulting in a water shortage. Drought is a phenomenon that always occurs on our planet in some form at a given time and can have serious impacts on people’s health, society, economies, agriculture and environment.
We believe that having a tool allowing professionals as well as regular users to analyse current drought situation could greatly improve efforts to cope with drought and making appropriate decisions.
There are three layers: soil moisture, moisture anomalies, and drought intensity.
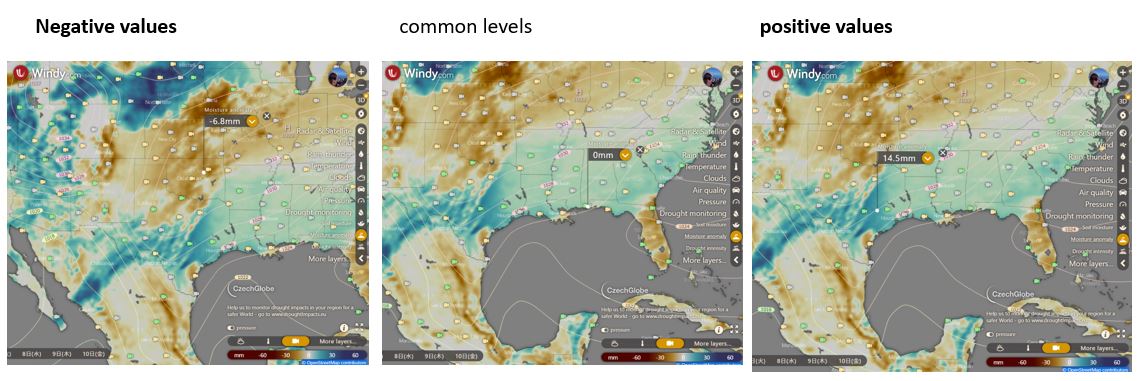
Layer Moisture anomaly
Available water deficit is the amount of water in mm/inch per the visualized soil column that is missing (or is in surplus) compared to the common levels (average of 1961 to 2010) of available water at the given site and time of the year. Negative values represent less water than usual while positive values represent a higher available water amount than is common.
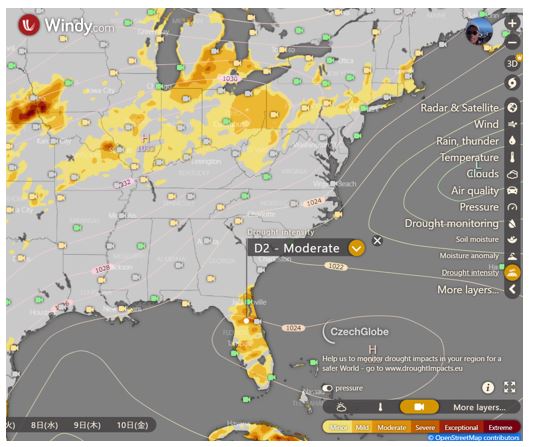
Layer Drought intensity
Drought intensity compares the actual amount of water available to plants with the values recorded for the given area during the same time period of the year between 1961 and 2010.
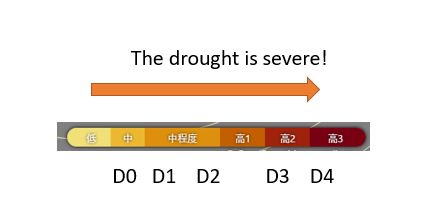
A drought intensity class represents the probability of recovery during a particular drought period.
The National Oceanic and Atmospheric Administration classifies the severity of drought into five grades.
(D0) extreme drought
(D1) moderate drought
(D2) severe drought
(D3) extreme drought, and (D4) unparalleled drought.
summary
The weather forecast app Windy.com is a free app that tells you the weather conditions at a glance on a screen that visualizes weather information around the world.
However, it is prohibited to be overconfident with Windy.com alone.
Please also check the weather forecast of the Meteorological Agency and others.
Windy Related article
Windy’s related article is below, please refer to it.
How to use Windy.com for sea, river, mountain weather forecast
windy.com Types and descriptions of the display on the map
Windy.com Mountain Climbing Utilization Editionきうん)Windy.com What kind of layer?
Windy.com Utilization of fishing
Windy.com Surfing Utilization Edition
コメント