- Types and descriptions of the display on the map
- Particles animation of the display on the map
- Pressure isolines of the display on the map
- Geopotential altitude Isolines
- Temperature isolines
- Freezing altitude isoline
- My favorites of the display on the map
- Reported wind of the display on the map
- Reported temperature of the display on the map
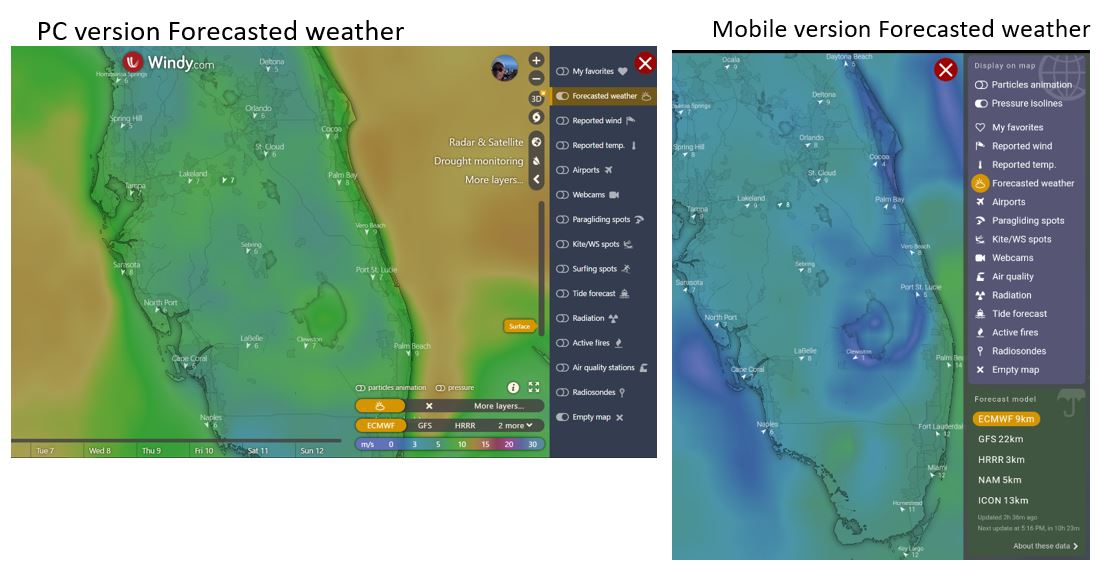
- Focasted weather of the display on the map
- Airports weather of the display on the map
- Paraglider spot of the display on the map
- Kite board、windsurfing spot of the display on the map
- Surfing spot of the display on the map
- webcam of the display on the map
- Air Quality of the display on the map
- Radiation dose of the display on the map
- Tide forecast of the display on the map
- Active Fires of the display on the map
- Radiosonde of the display on the map
- summary
Types and descriptions of the display on the map
In windy, there are items such as contour lines, paragliding spots, fire outbreaks, tide forecasts, etc. displayed on the map separately from layers.
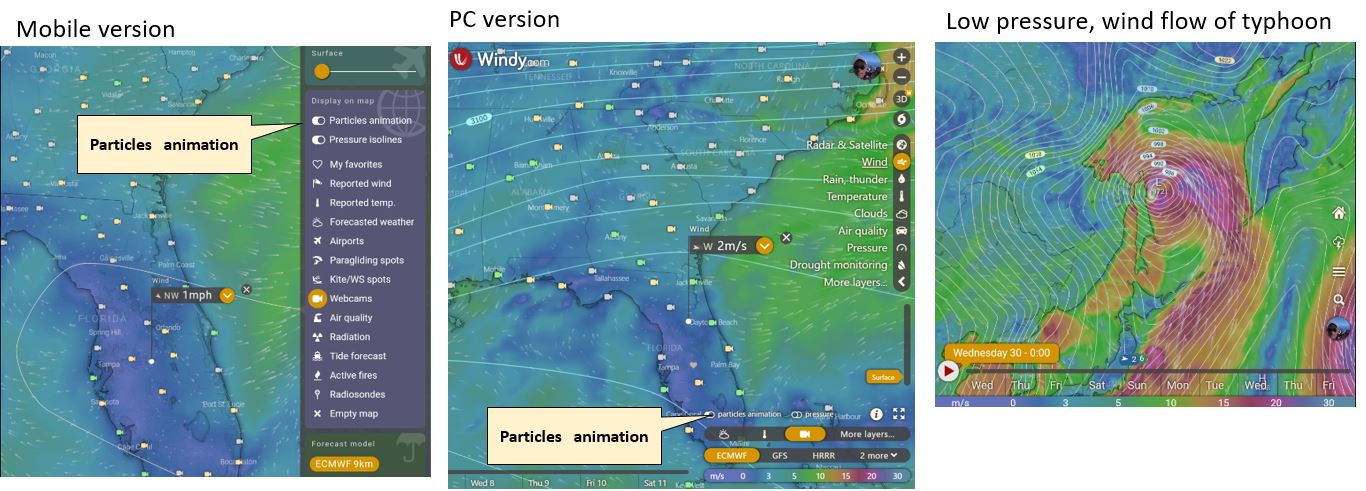
Particles animation of the display on the map
“Particle animation” is on by default, turning it off will not show the wind flow arrow animation.
With this function, you can visually grasp the flow of the wind in that area, which is convenient.
In addition, it is useful for disaster prevention because it can grasp the wind flow of low pressure and typhoon.
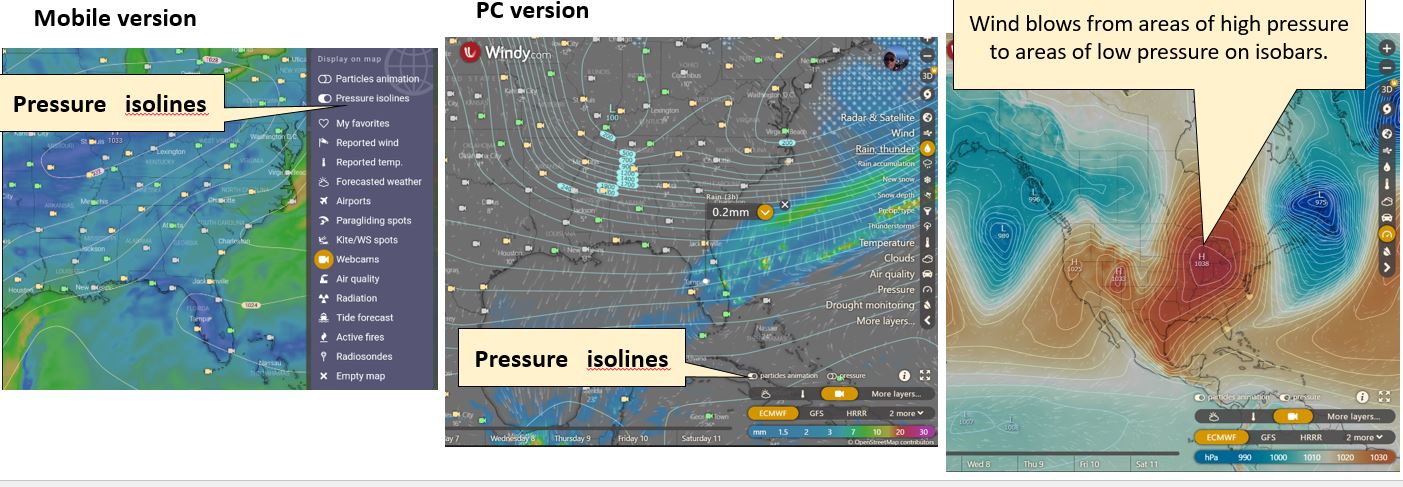
Pressure isolines of the display on the map
When “Pressure Isolines” is turned on, the isolines of atmospheric pressure is displayed. Isolines are lines that connect points of equal atmospheric pressure on a surface weather map.
Wind blows from areas of high pressure to areas of low pressure on isolines. The closer the isolines are, the steeper the slope of the atmospheric pressure and the stronger the wind.
The interval between isobars narrows near the center of a low pressure and widens near the center of a high pressure.
Geopotential altitude Isolines
Geopotential altitude is the height calculated using the observed pressure, temperature, and humidity.
If you click on the geopotential height, the isoline of the geopotential height will be displayed. However, it is currently PC version only.
After clicking the Geopotential heights you have to adjust the Altitude slider to 500 or 850hPa.
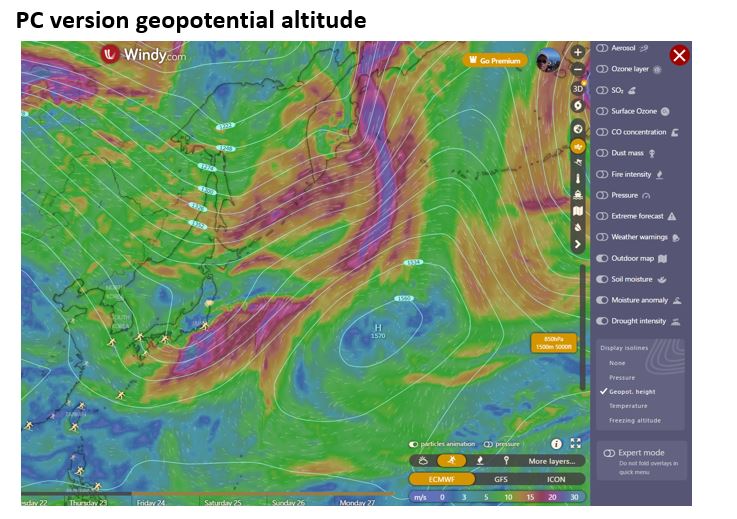
At atmospheric pressure 850hpa: The theoretical altitude is 1500m, but if the atmospheric pressure is low, the geopotential altitude will be low, and if the atmospheric pressure is high, the geopotential altitude will be high.
Normally, the atmospheric pressure is 850hpa and the geopotential altitude is 1,500m, but when a low pressure system is approaching, the atmospheric pressure becomes 850hpa even if the altitude is below 1500m.
Also, when approaching high pressure, the atmospheric pressure will be 850hpa even if the altitude is over 1500m.

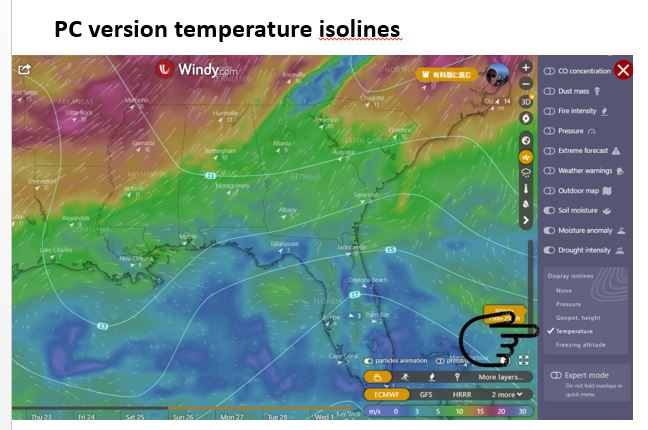
Temperature isolines
If you click on the temperature, the temperature isolines (isothermal lines) will be displayed,
but currently only for the PC version.
Isotherms:
A line connecting points of equal temperature on a weather map.
By drawing isotherms on a map, warm and cool areas become clearer,and changes in the isotherms over time make it possible to know the movement of warm and cold air masses.
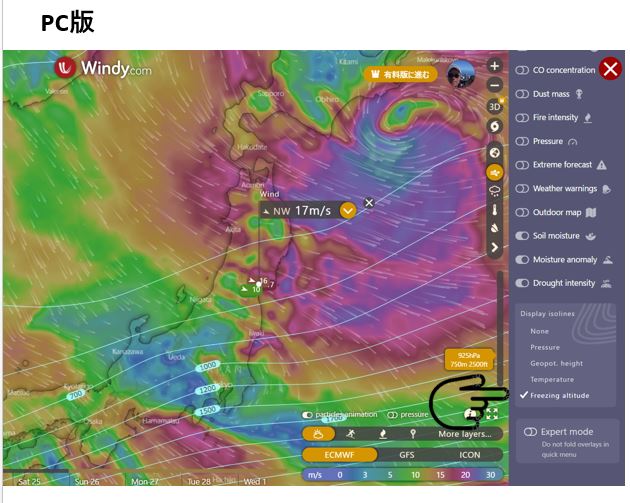
Freezing altitude isoline
Freezing altitude: Isolines display the altitude at which the temperature is 0°C (freezing point of water).If you click on the freezing level, Isolines of the freezing level will be displayed, but currently only for the PC version.
Freezing altitude:
Freezing altitude is the altitude at which water freezes.
It is a factor closely related to the generation of dry snow (powder snow)
, wet snow, and ice, which are types of snow quality.
If the temperature stays below 0 degrees all day long, the snow will not
melt and will remain dry.
If the daytime temperature is 5°C and the nighttime temperature is
-5°C, the snow will melt during the day and the melted snow will
freeze solid at night, creating an ice burn.
Freezing level is closely related to snow quality.
Freezing altitude is closely related to snow quality and is an important index for skiers and snowboarders.
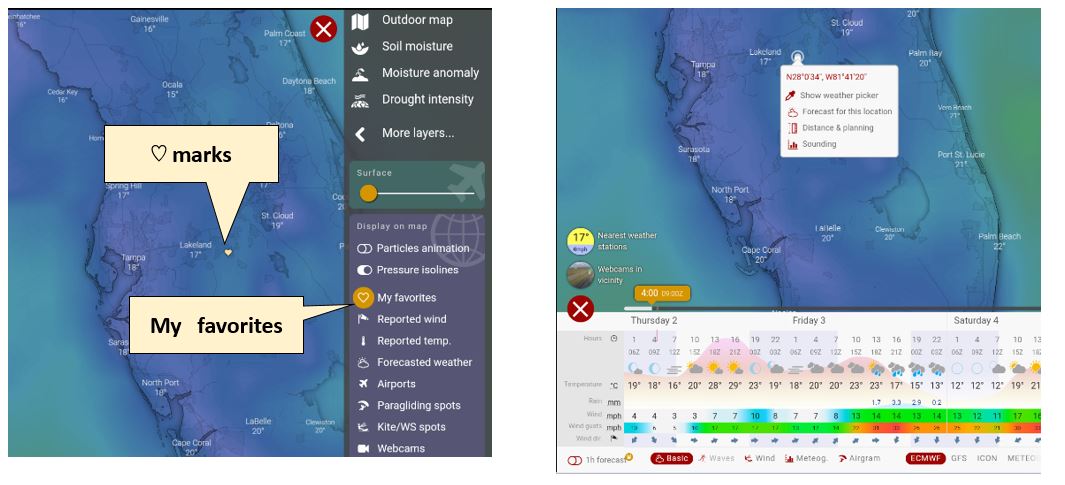
My favorites of the display on the map
When you click “Favorites”, the registered “favorite” places are displayed as ♡ marks on the map.
If you click the ♡ mark, the weather tag of the “favorite” point will be displayed and you can know the weather immediately.
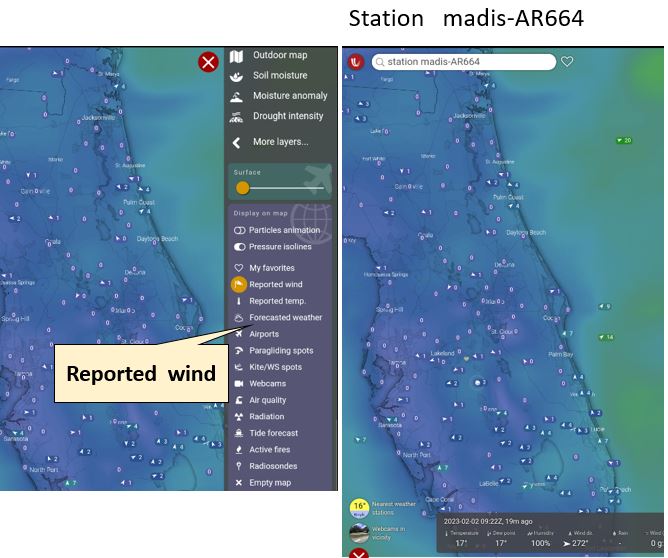
Reported wind of the display on the map
Displays the reported wind measurements of each country’s stations listed in the International Point List(under WMO).
Also, there are Modis and ad type as station types.
*WMO:The World Meteorological Organization (WMO) is a specialized agency of the United Nations responsible for promoting international cooperation on atmospheric science, climatology,hydrology and geophysics.
*Modis: Moderate Resolution Imaging Spectroradiometer
Reported temperature of the display on the map
Displays the reported temperatures (measured values) of stations in each country listed in the International Station Number Table (under WMO jurisdiction).
Also, there are Modis and ad type as station types.
*WMO:The World Meteorological Organization (WMO) is a specialized agency of the United Nations responsible for promoting international cooperation on atmospheric science, climatology,hydrology and geophysics.
*Modis: Moderate Resolution Imaging Spectroradiometer

Focasted weather of the display on the map
Although it is simple, you can check the weather information of each city at a glance.
Airports weather of the display on the map
Click the airplane mark to turn it on to display airports and heliports around the world, and click the corresponding airport or heliport to display maps of airports and heliports, weather information, webcams, and (NOTAM) aviation information.
With windy, you can check the weather information and typhoon information on the date of boarding in advance, which is useful for sightseeing and business trips.
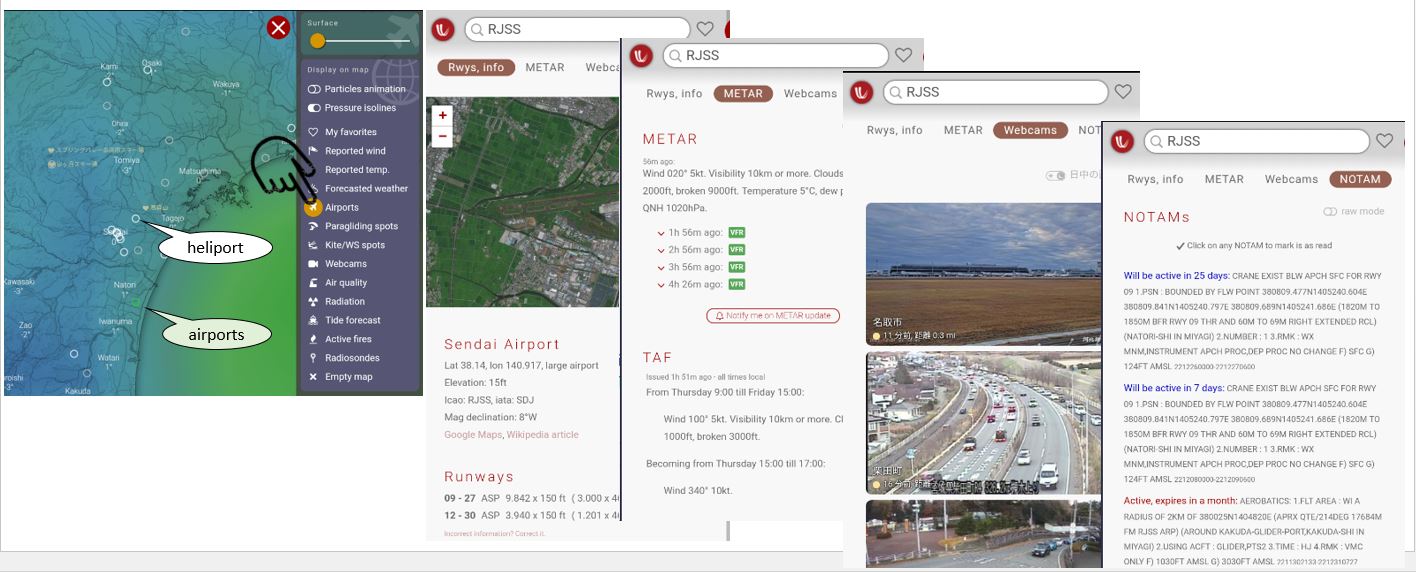
Rwys,info: Displays information such as airport locations and runways
METAR:It is a type of regular aviation live weather report format, weather report format, and is a format for reporting aviation weather information in alphanumeric characters.
It is also used by meteorologists for weather forecasts. Derived from French.
METAR displays the current weather conditions around the airport (date and time of announcement, wind direction and speed, visibility, precipitation, runway visual range and visibility obstruction phenomena, current weather, cloud cover, cloud height, temperature dew point, atmospheric pressure, etc.) .
The corresponding airport is indicated by the ICAO international four-letter abbreviation.
*ICAO is an abbreviation for “International Civil Aviation Organization”.
TAF:Terminal aerodrome forecast、TAF can know the weather forecast around the airport from 0 to 27
hours ahead.
*NOTAM is a type of aviation information, and is information about settings, conditions, changes, etc. related to aviation-related facilities, operations, methods and dangers. Acronym for “Notice To Airmen or “Notice To Air Mission“.

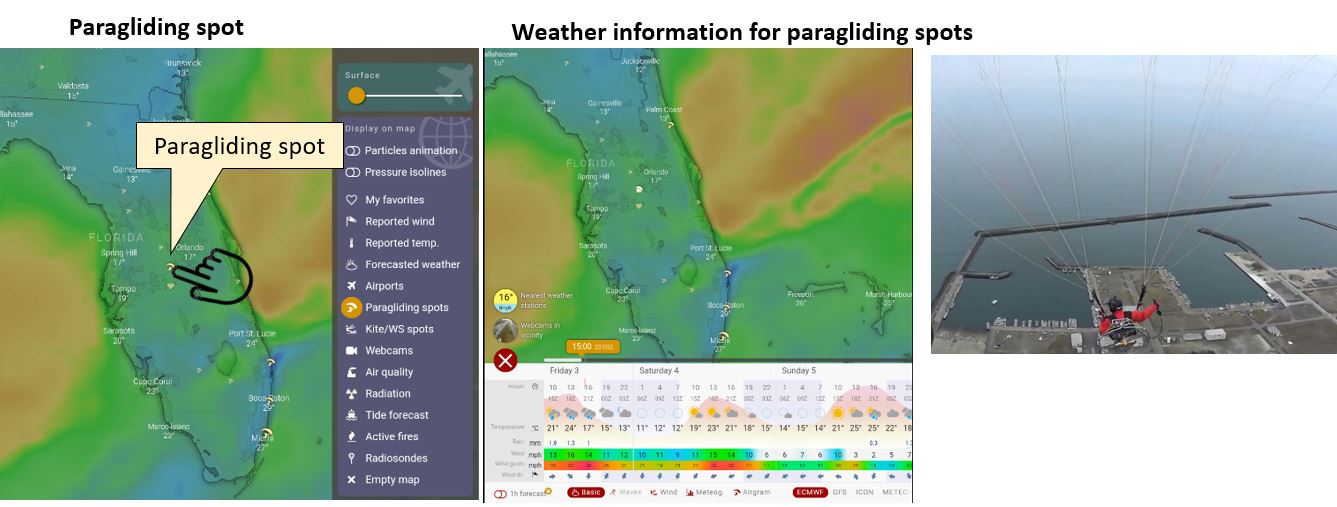
Paraglider spot of the display on the map
The world‘s recommended paragliding spots are displayed. Weather information is displayed when you click the corresponding point.
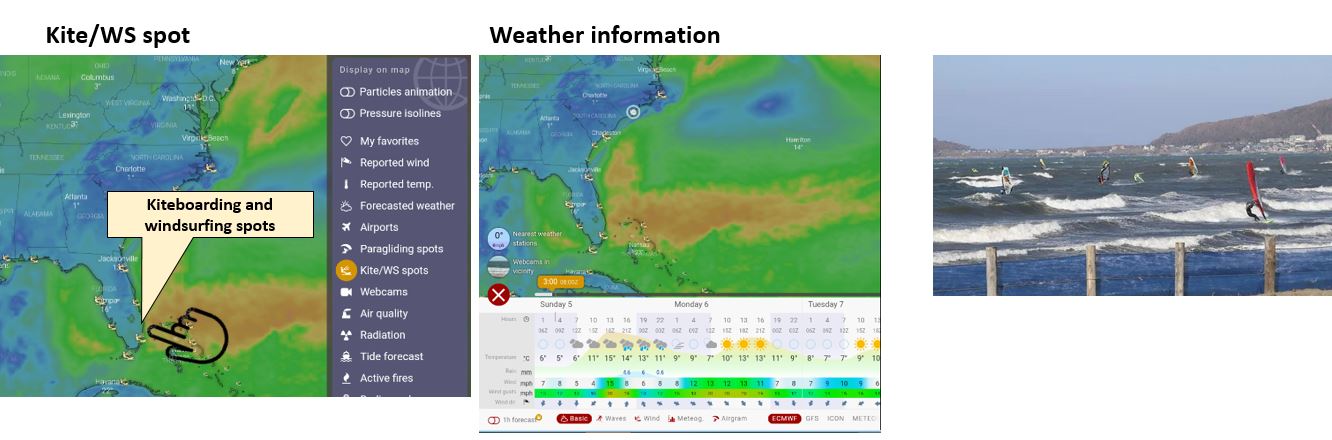
Kite board、windsurfing spot of the display on the map
Recommended points for kiteboarding and windsurfing around the world are displayed.
In addition, weather information is displayed when we click applicable point.
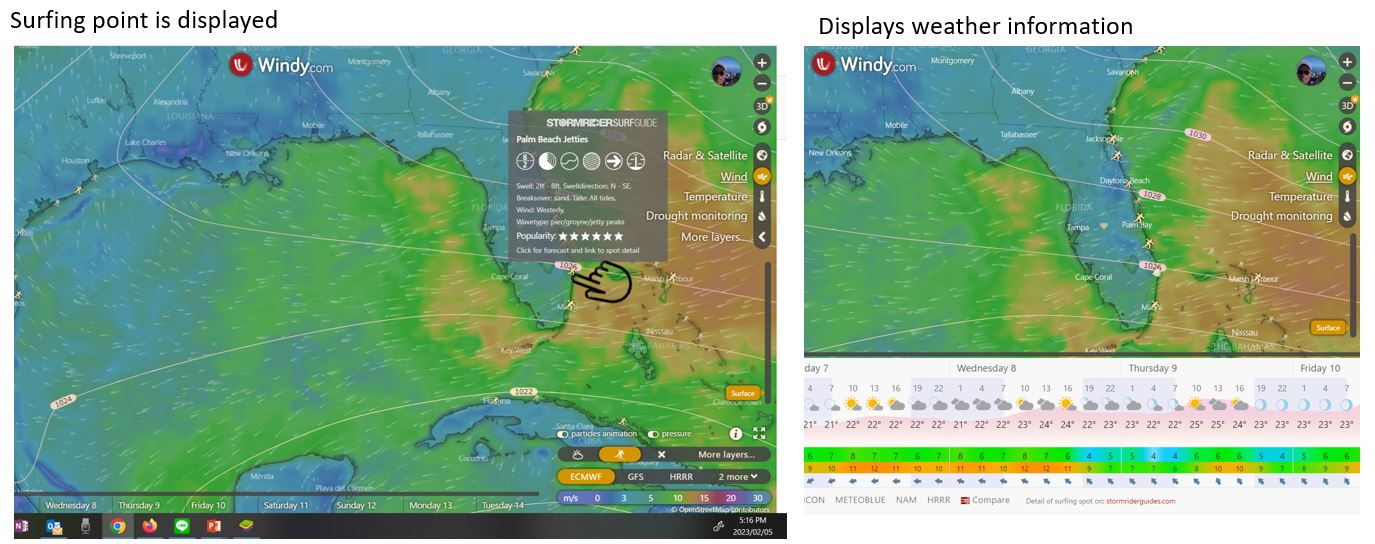
Surfing spot of the display on the map
Pressing the surfing icon will display registered surfing points around the world.
Weather information is displayed when you click a point. However, PC version only.
In addition, the information of The Stormrider Surf Guides is displayed.
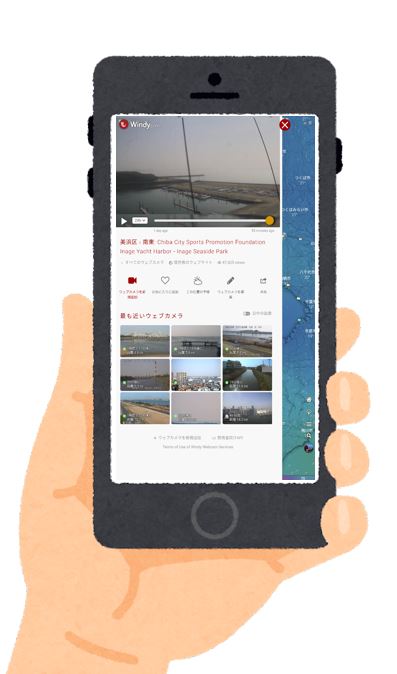
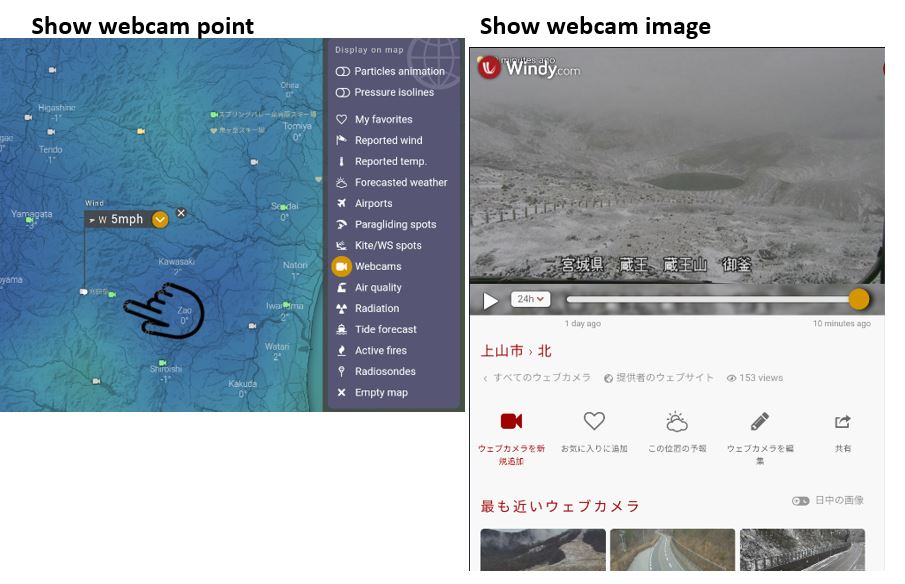
webcam of the display on the map
Pressing the webcam icon will display the points of registered webcams around the world.
Click the point to view the webcam image.
Air Quality of the display on the map
The atmosphere is the gas that covers the surface of the earth in layers, and the air quality index is an index that conveys the status of daily air pollution to citizens in an easy-to-understand manner from the perspective of health effects.
Measurement results are expressed in numerical values such as ppm and μg/m3.
“Air Quality” on the mobile version, and “Air Chamber Observatory” on the PC version will be displayed.
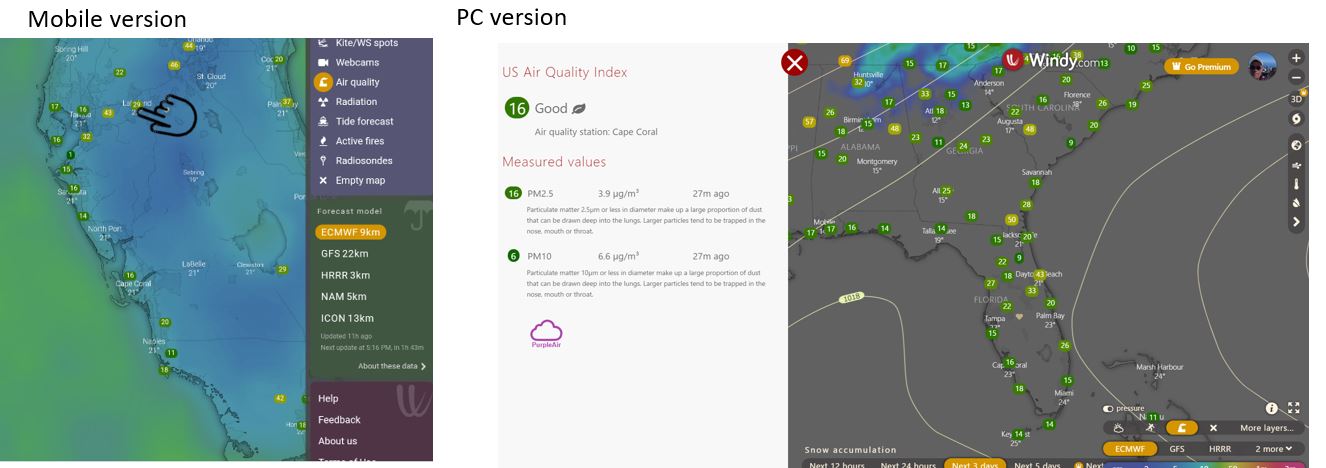
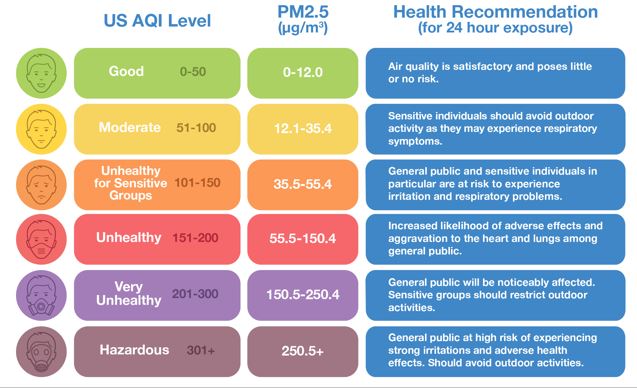
American Air Quality Index:
Windy displays the Air Quality Index (AQI) of the United States Environmental Protection Agency (EPA).
The AQI of the United States Environmental Protection Agency (EPA) has six levels, and when the index exceeds 100, it is said that the Sensitive Groups (sensitive groups) are affected. The Sensitive Groups for each contaminant are as follows.
Ozone: people with lung disease (respiratory disease), children, the elderly, people exercising outdoors Particulate Matter (PM10, PM2.5): People with lung and heart disease, children and the elderly Carbon monoxide: people with heart disease Sulfur dioxide: people with asthma
A value exceeding 100 is considered an important criteria for judging health effects.
Radiation dose of the display on the map
There are various types of radiation such as “alpha rays”, “beta rays”, “gamma rays”, “X rays” and “neutron rays”.
Radiation is harmful to living organisms and, depending on its intensity, can cause death.
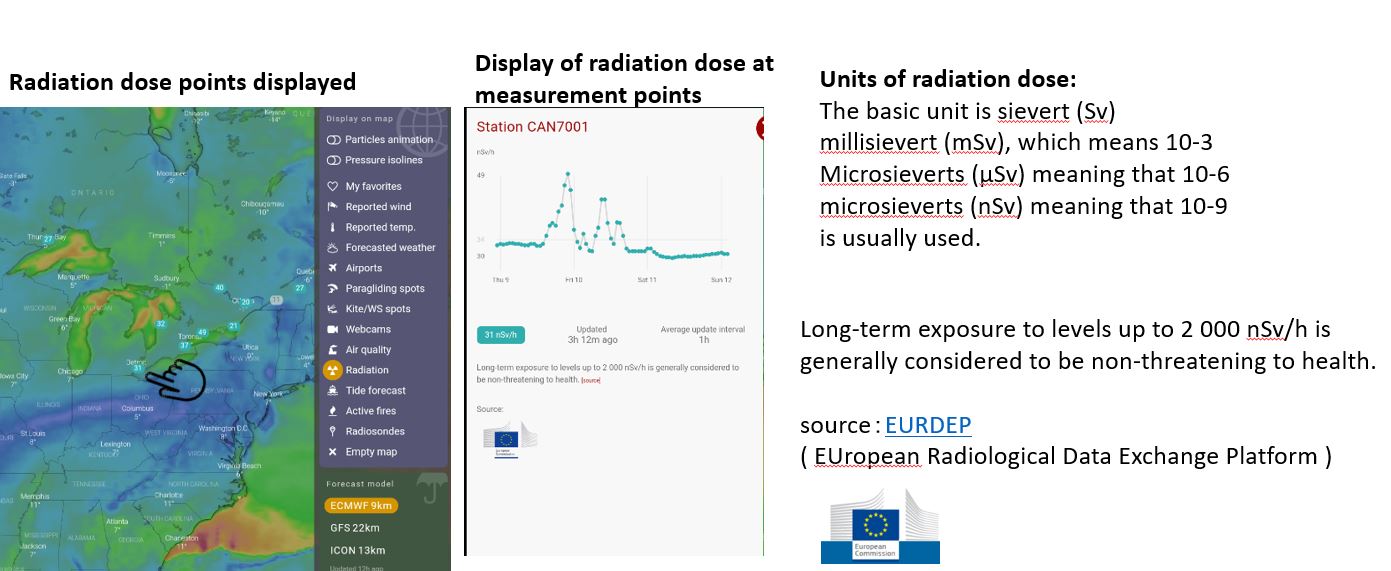
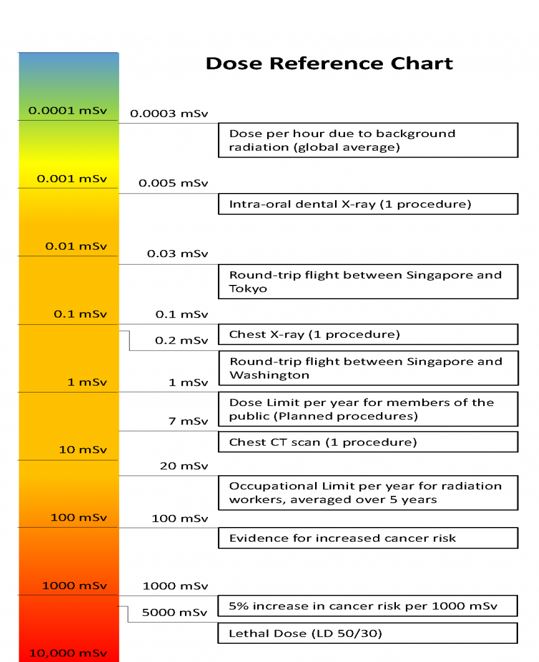
Guideline for radiation dose
According to the 2007 recommendations of the International Commission on Radiological Protection, the upper limit of exposure for ordinary people (including children) is 1 millisievert (1000 microsieverts) per year.
Ionizing radiation are capable of ionisation of atoms or molecules in living cells and thereby damage their genetic material(DNA). In the event where the cell is not repaired correctly, the cell may die or become cancerous. However, our cells have adapted to regularly check for damage to the cells and incorporate repair mechanisms if any is discovered. Hence receiving small dose of radiation will have little effect on your body.
It is estimated that a person will naturally receive around 2.4 mSv of radiation dose per year. The figure on the left is a dose reference chart that showcase some notable radiation dose exposure
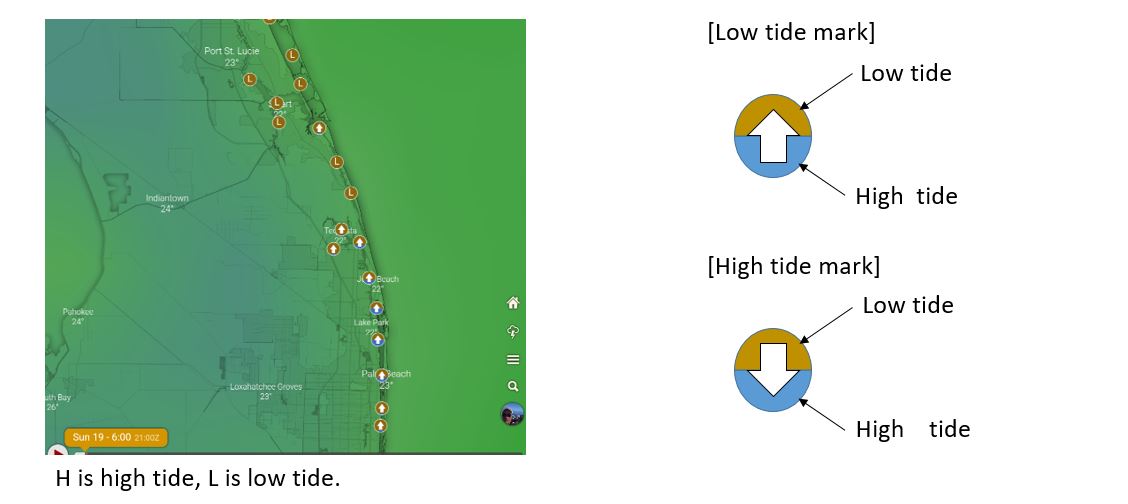
Tide forecast of the display on the map
Pressing the tide forecast icon displays registered tide forecast points around the world.
Clicking on a point will display the low tide, high tide time, and tide level at each point.
If you press the time series button, you can see the tide for each hour.
The tide at each point is brown for low tide and light blue for high tide, so you can see the tide status with the high and low tide mark.
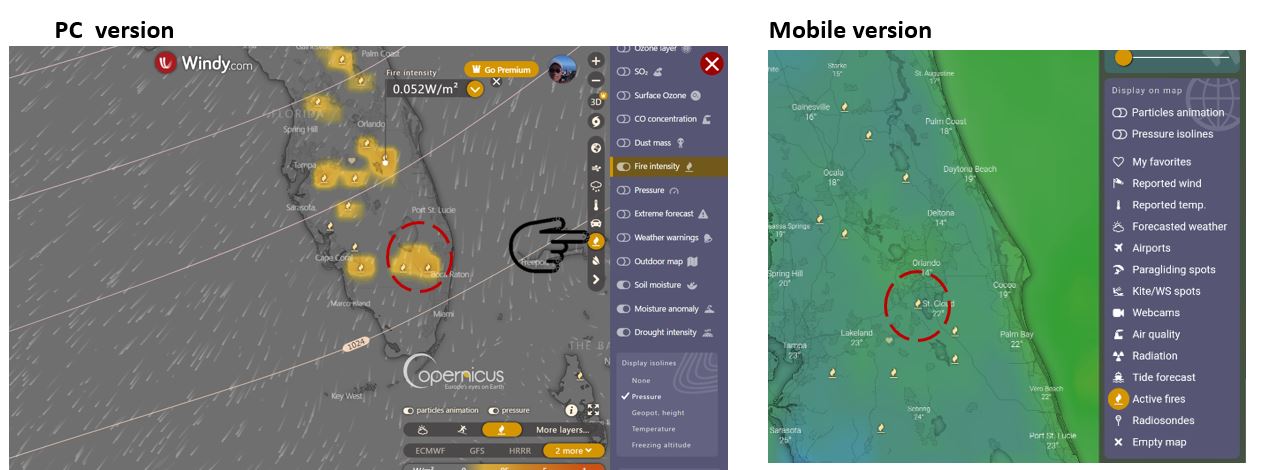
Active Fires of the display on the map
Location information during fires is provided by the Global Fire Assimilation System (GFAS) and displayed on the screen.
The Global Fire Assimilation System (GFAS) detects radiant heat emitted from fires with satellite sensors and measures it as fire radiant power (FRP).
The unit is [mW/m2].
Radiosonde of the display on the map
A radiosonde is a radio-equipped meteorological observation device that is mainly attached to a rubber balloon and flown in order to obtain data such as temperature, humidity, and atmospheric pressure up to an altitude of about 30 km while on the ground.
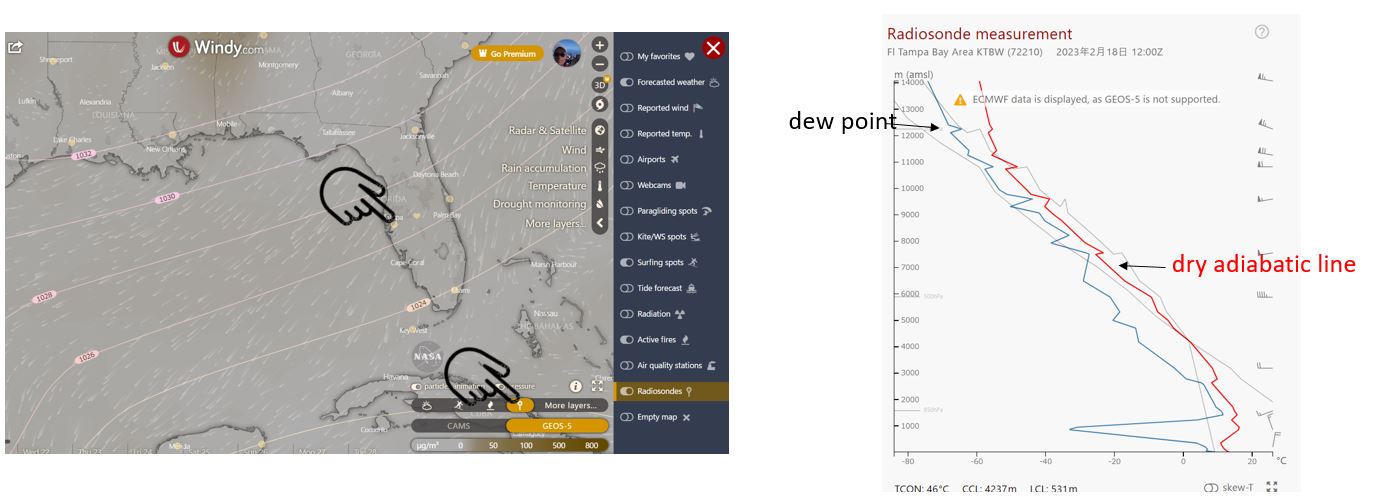
What is an emagram?
An emagram is one of the adiabatic diagrams (thermodynamic diagrams) used in weather.
It plots the relationship between air pressure, temperature, and dew point above a certain point on a graph with temperature on the horizontal axis on a constant scale and atmospheric pressure on the vertical axis on a logarithmic scale. It is used to evaluate the stability of the atmosphere above a certain point.
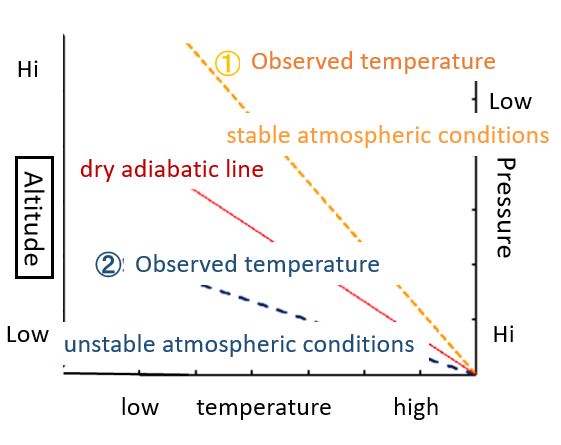
The thin red line is the dry adiabatic line, which shows the temperature change when the air near the surface is virtually raised.
Stable atmospheric conditions:
If the observed value shown in orange ① at the same altitude shows a higher temperature, this means that when an updraft is generated for some reason and the air near the surface is lifted, the temperature of the lifted air is higher. means lower. Air that is colder (more dense) than its surroundings is heavier, so no updraft can develop. Such a situation is said to be “stable atmospheric conditions”.
Unstable atmospheric conditions: When the observed value ② is below the dry adiabatic line of the red line (the lifted air mass is warmer than the surroundings), the air mass gains further buoyancy and an upward flow develops. This is called “the atmosphere is unstable”, and phenomena with heavy precipitation such as cumulonimbus clouds are likely to occur in such places.
Quote: Japan Meteorological Agency Upper-air observation by radiosondes
summary
The weather forecast app Windy.com is a free app that tells you the weather conditions at a glance on a screen that visualizes weather information around the world.
However, it is prohibited to be overconfident with Windy.com alone.
Please also check the weather forecast of the Meteorological Agency and others.
Windy Related article
Windy’s related article is below, please refer to it.
How to use Windy.com for sea, river, mountain weather forecast
windy.com Types and descriptions of the display on the map
Windy.com Mountain Climbing Utilization Editionきうん)Windy.com What kind of layer?
Windy.com Utilization of fishing
Windy.com Surfing Utilization Edition
コメント